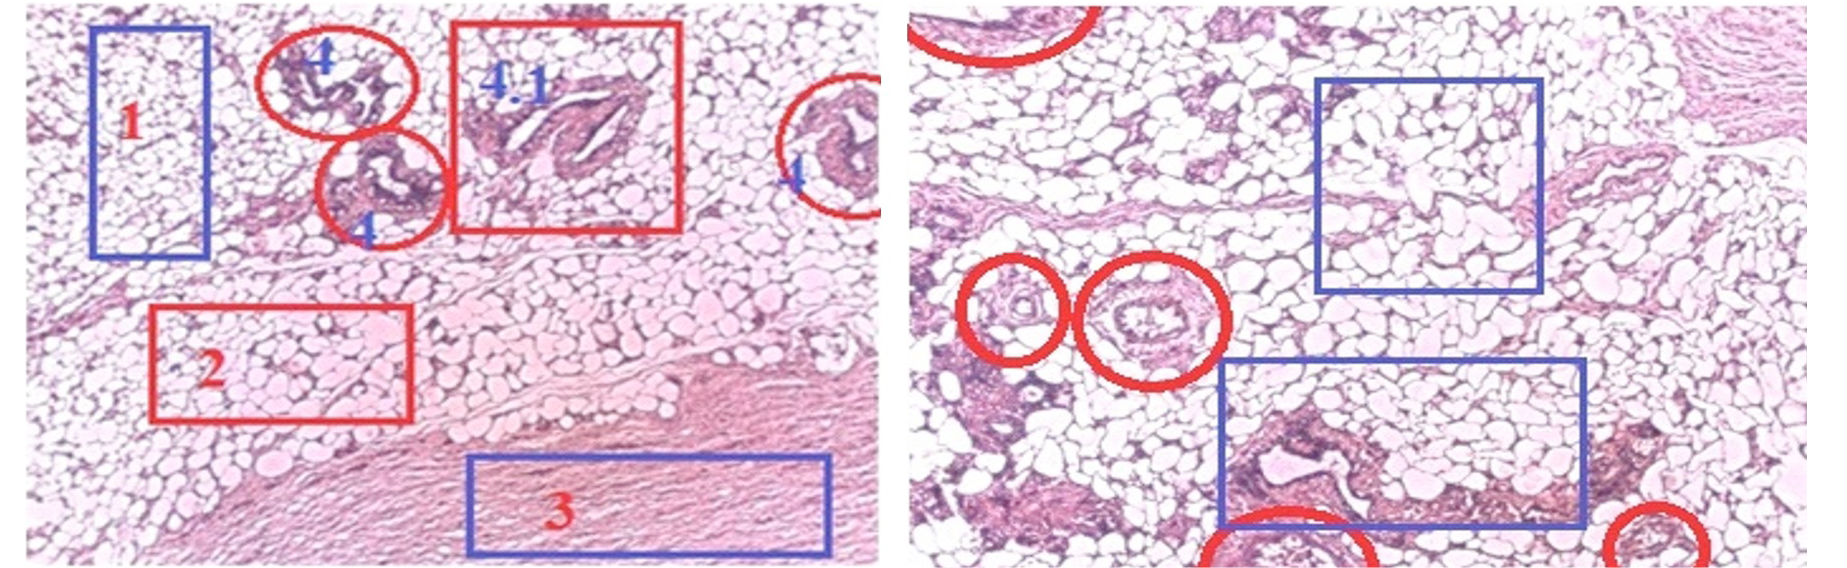
Fig. 7.
Cross section of Mammary gland tissue of non-lactating female control mouse (left) and test (right). Magnification is 1000x power of light microscope. 1 and 2 indicates an increase in adipose tissue with increased number of cells as compared to the control. Three circles in red color labeled as 4 are lobule (alveoli) of mammary glands, while the red color square marked as 4.1 is lactiferous duct.