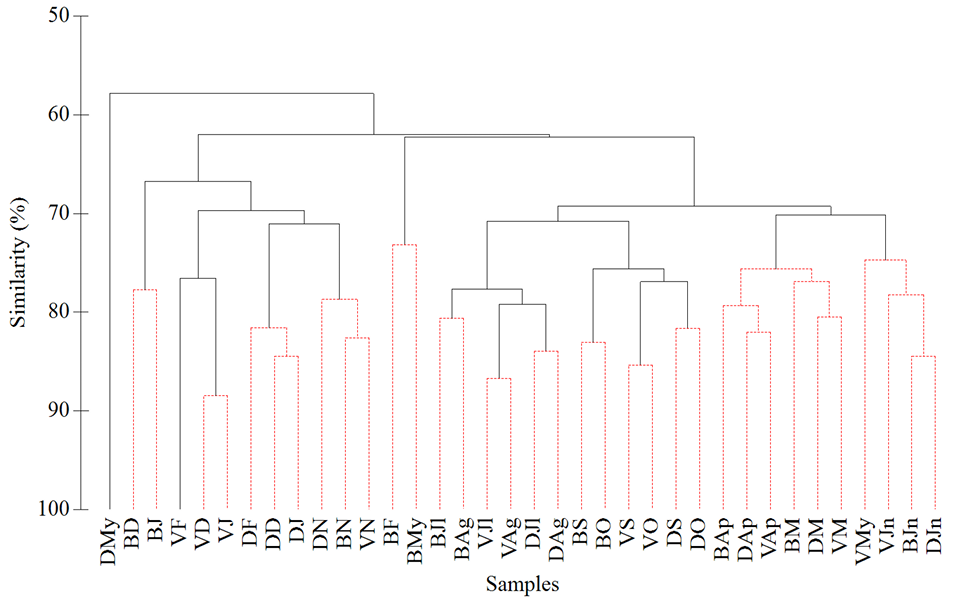
Fig. 4.
Cluster analysis dendrogram of bird transect samples based on Bray-Curtis similarity values. Red dashed lines represent clusters with significant community structures using a SIMPROF analysis. Sample prefixes refer to the site, while suffixes refer to the month (e.g. ‘DMy’ = Species sample similarity from Deva in May, 2018).