View larger version:
Download Original File
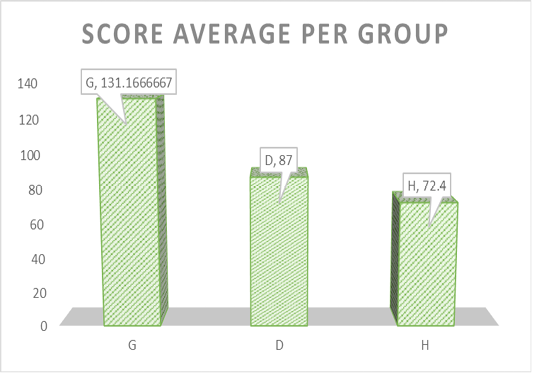
Figure 1
A chart displaying the difference in the average score between the three groups.