
Figure 6:
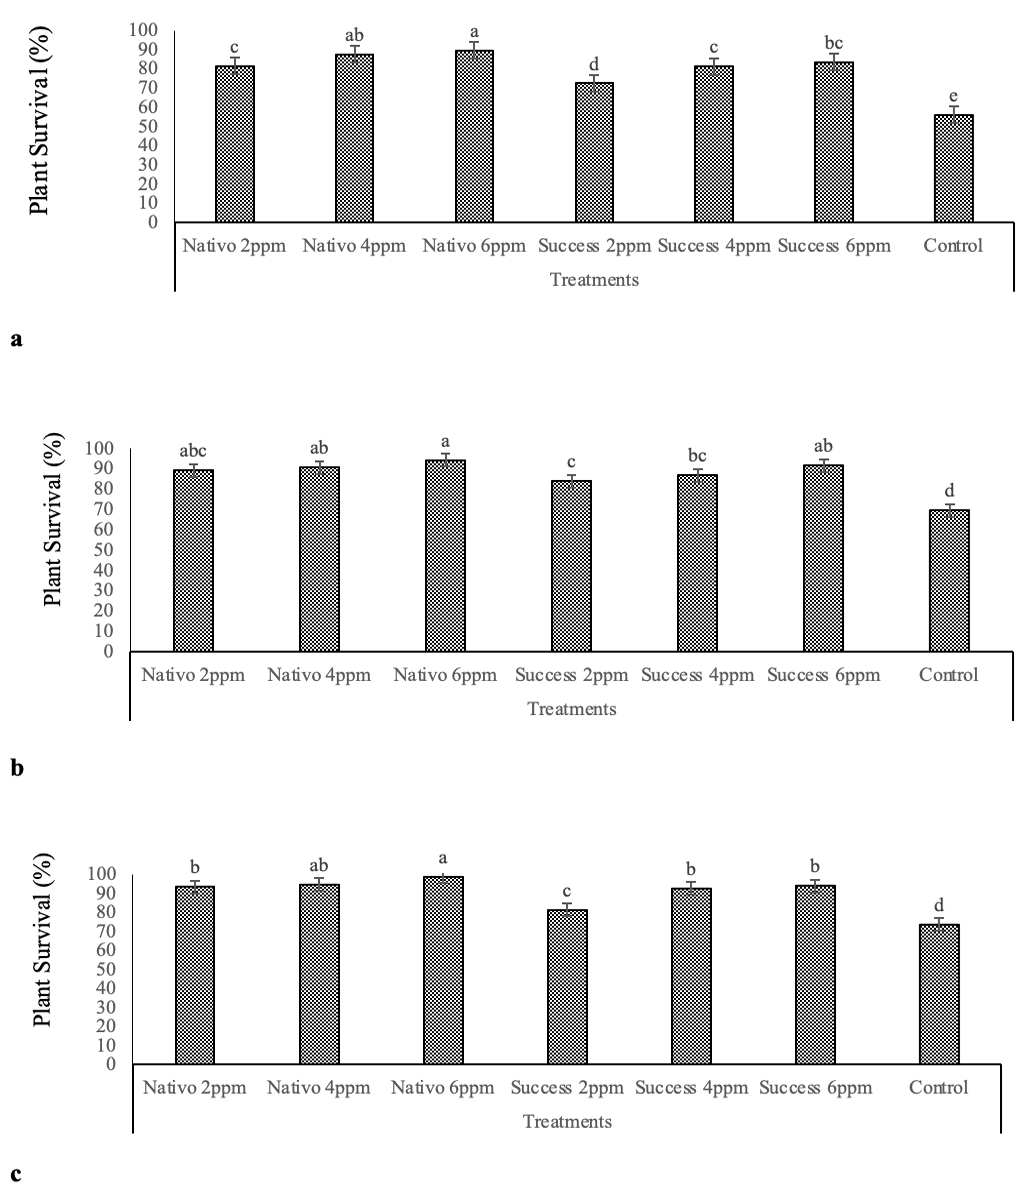
Mean performance of different chemical for plant survival (%) at 15th day (a) 30th day (b) and 45th day (c) of treatment.
Mean performance of different chemical for plant survival (%) at 15th day (a) 30th day (b) and 45th day (c) of treatment.