
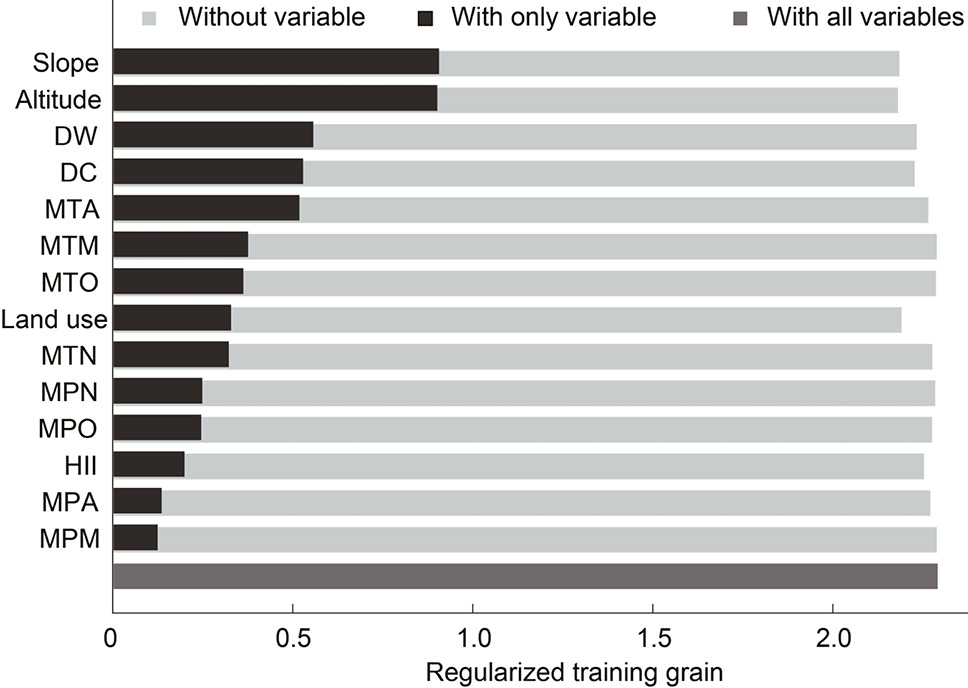
Fig. 3.
Result of the jackknife test of environment variable importance. Black bars indicate the gain achieved when using that predictor only and excluding the remaining predictors; light gray bars show how the total gain is diminished without the given predictor. Distance to waterbody (DW), distance to coastline (DC), human influence index (HII), mean temperature of March (MTM), April (MTA), October (MTO) and November (MTN), mean precipitation of March (MPM), April (MPA), October (MPO) and November (MPN).