
Figure 4
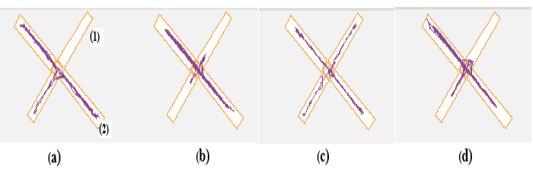
Plus-maze track plots.
Plus-maze track plots show the position of the center of the animal, where (1) is the open arm, and (2) is the closed arm. (a) BC Balb/c control, (b) BMAS Balb/c multiple acute stress, (c) SC Swiss control, and (d) SMAS Swiss multiple acute stress groups.