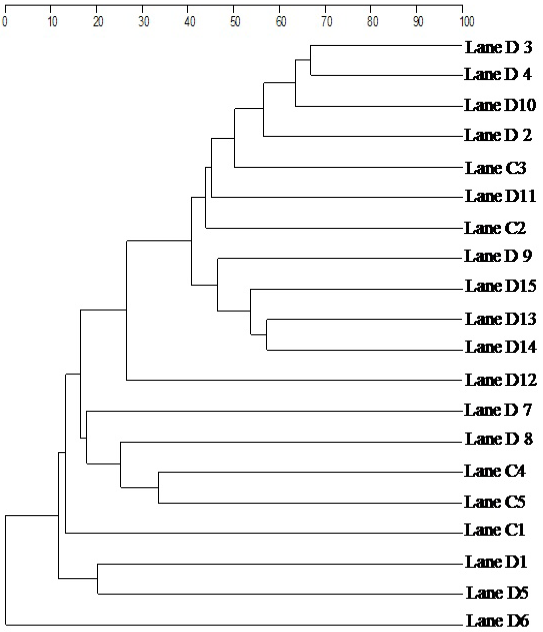
Fig. 2.
Cluster analysis between asthma patients (D1-D15) and healthy control (C1-C5) by applying UPGMA and Dice’s similarity coefficient.
Cluster analysis between asthma patients (D1-D15) and healthy control (C1-C5) by applying UPGMA and Dice’s similarity coefficient.