
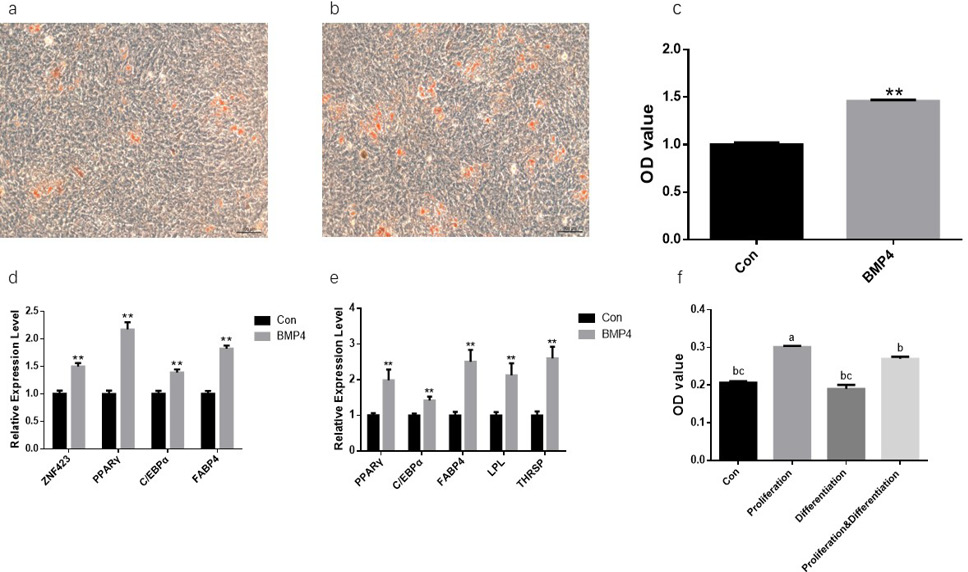
Fig. 2.
BMP4 promoted the efficiency of adipogenic differentiation of PDGFRα⁺ cells. (a, b) ORO staining at day 9 after treating cells without (a) or with (b) BMP4 during proliferative phase. Scale bar, 100 μ m. (c) The OD value of ORO staining intensity of control and BMP4 group on day 9. (d, e) Relative genes expression of adipocyte-specific genes on day 4 (d) and day 9 (e). (f) The OD value of ORO staining intensity in different treatment strategies, treating with BMP4 during proliferation, differentiation and both proliferation and differentiation. The values with different superscript letters in a column are significantly different (p<0.05). Bars denote means ± SEM (n =6 wells for each condition; **p < 0.01 versus control).