View larger version:
Download Original File
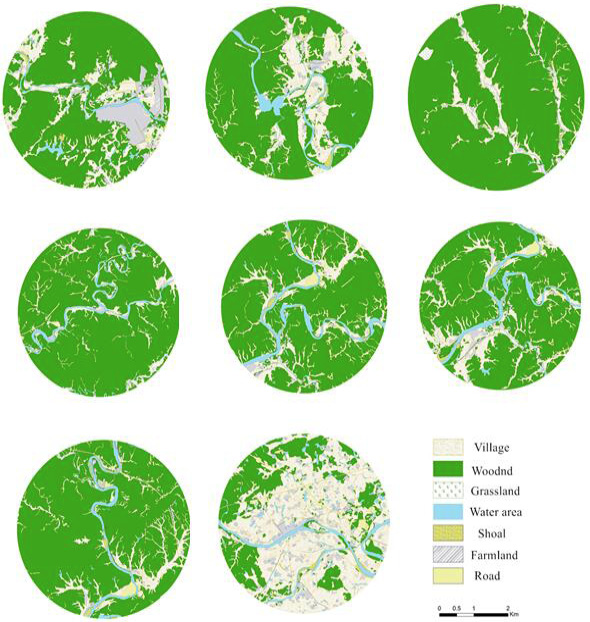
Fig. 3.
Control plots at 5000-m scale.
