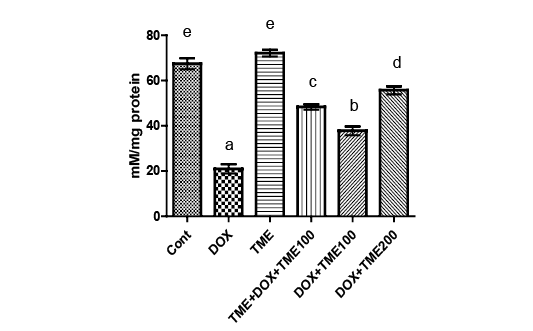
Figure 5
GSH in Cardiac tissue (mM/mg protein) ) of rats in control group and under influence of different treatments. . Each bar represents a mean value ±SE and the presence of different letter on the bar means a significant difference between groups