
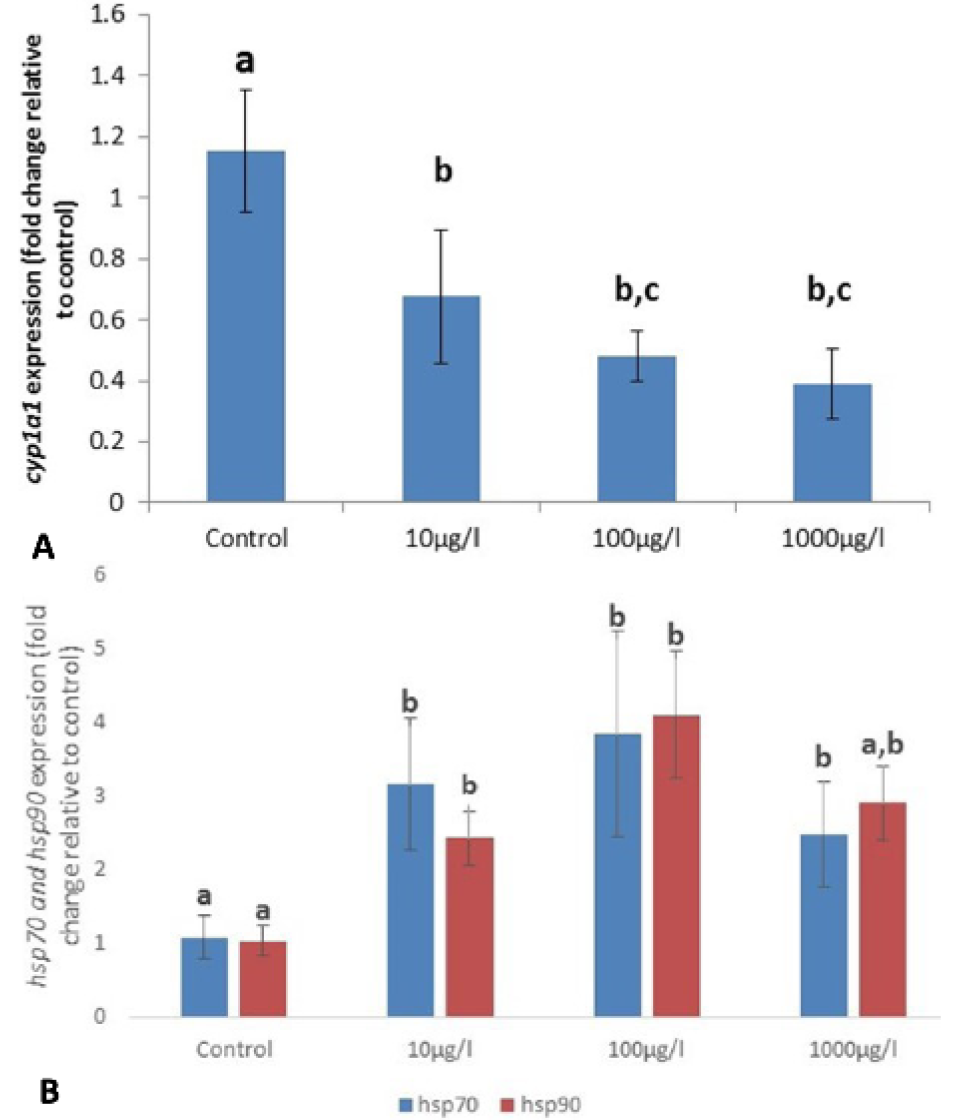
Fig. 2.
Relative gene expression of the cytochrome p450 1a1 gene normalized tbp and gapdh (A) and heat shock protein 70 and 90 normalized to mean of three selected gene (gapdh, tbp) (B) in liver of Catla catla (n=3) after 14 days of exposure to graded concentration of BPA. Data expressed as mean fold change ±S.E.M. Different letters indicate significant differences among groups. P<0.05.