
Fig 4
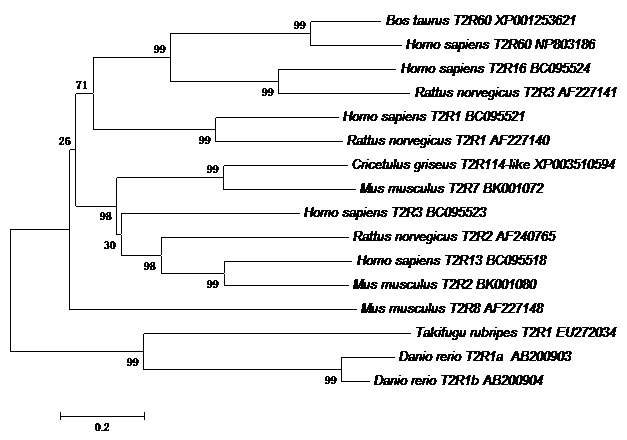
Phylogenetic tree revealing the relationship of T2R1 in T. fasciatus relative to other T2Rs family members of other species. Note: the horizontal branch length is proportional to amino acid substitution rate per site. The numbers represent the frequencies (%) with the tree topology presented was replicated after 1000 iterations.