
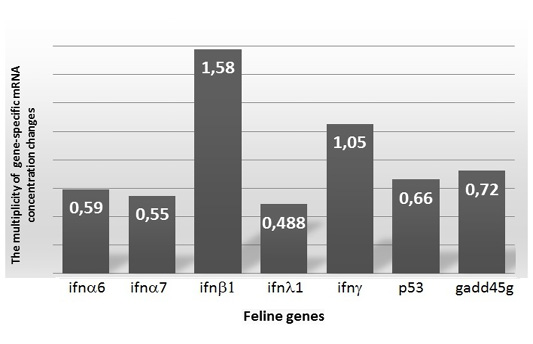
Figure 2
Differences in expression of interferon, p53 and gadd45g genes in blood leukocytes from group 2 cats relative to group 1.
Relative expression levels of target genes normalized by the gapdh. The values presented are quotients of the expression values in group 2 by the expression values in group 1 (Fold2 / Fold1).