
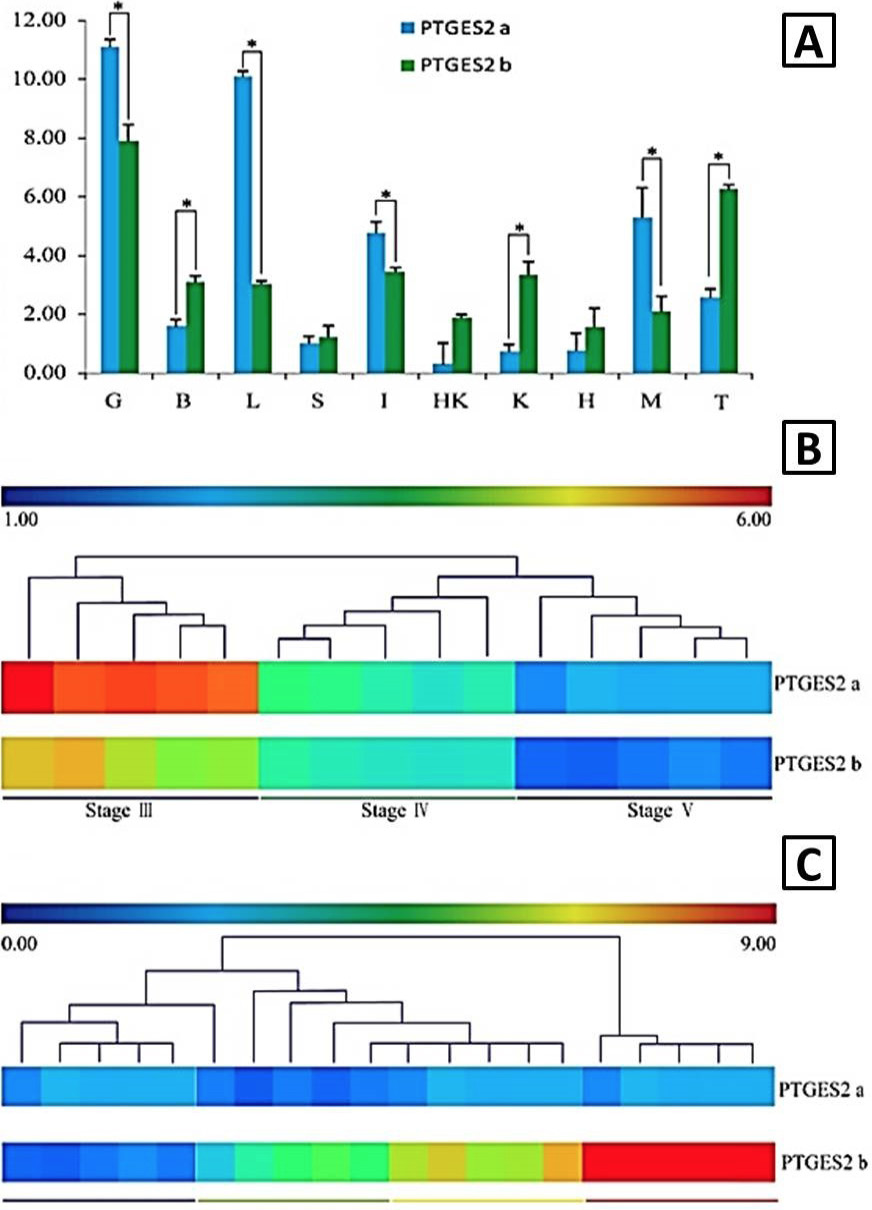
Fig. 6.
The expression profiles of PTGES2a and PTGES2b mRNA. A, RT-qPCR analysis of the expression profiles of PTGES2a and PTGES2b mRNA in different Coilia nasus tissues. Data are expressed as the ratio of PTGES2a mRNA expression in the tissue to its expression in the spleen (mean ± SD); B, expression profiles of PTGES2a and PTGES2b in the ovary at different stages. Data are expressed as the ratio of PTGES2b mRNA at different stages to expression in stage V (Log 2 transformed); C, expression profiles of PTGES2a and PTGES2b during the spawning process. Data are expressed as the ratio of PTGES2a mRNA expression to expression in the controls (0 h, Log 2 transformed).