View larger version:
Download Original File
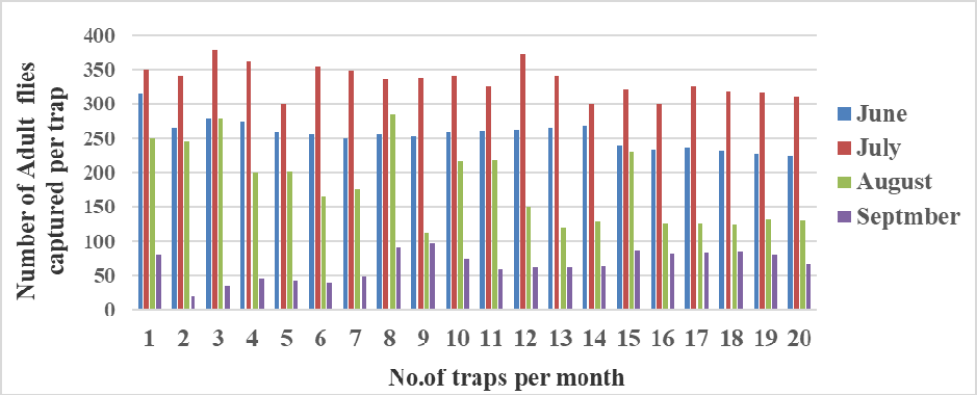
Figure 3:
Shows the per trap population during 2015.