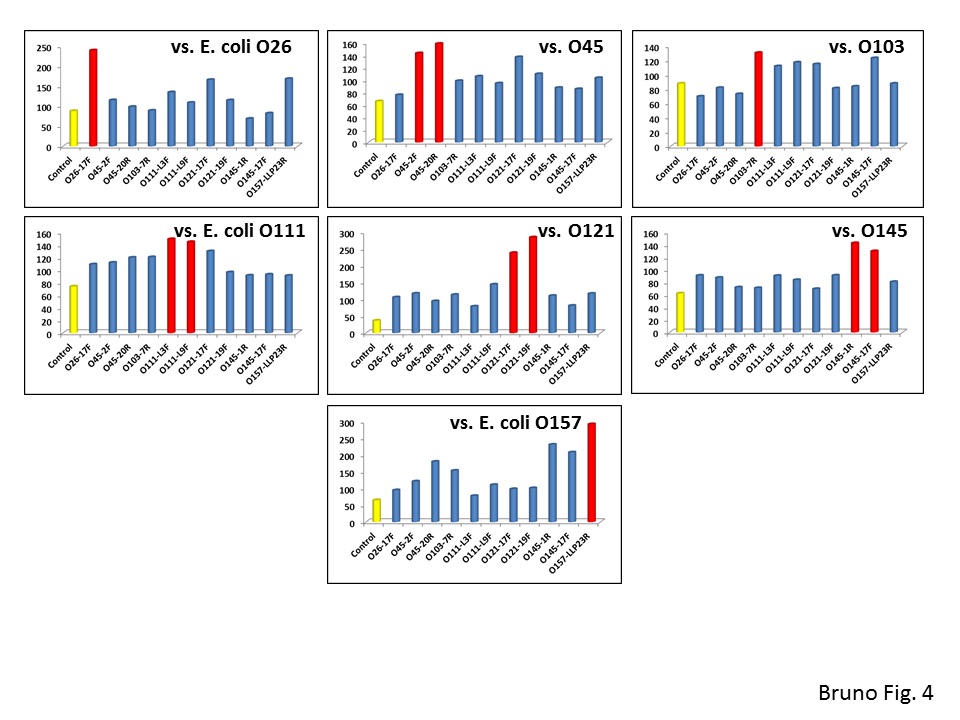
Results of fluorescence microplate-based aptamer-MB capture cross-reactivity experiments. X-axes list the type of aptamer-coated MBs used to capture the added E. coli serovar cells listed in the upper right corner of each panel (e.g., vs. E. coli O26, etc.). Y-axes give the relative fluorescence intensity of each microwell measurement. Yellow bars represent the negative control (evaluation of AO-stained E. coli O157 non-specific adherence to SAv-MBs) fluorescence intensity values in each graph. Note that despite significant cross-reactivity between serotypes, the aptamers captured their cognate serotypes best (red bars), suggesting some utility for enrichment of specific serotypes from food samples followed by specific PCR or other genetic detection techniques