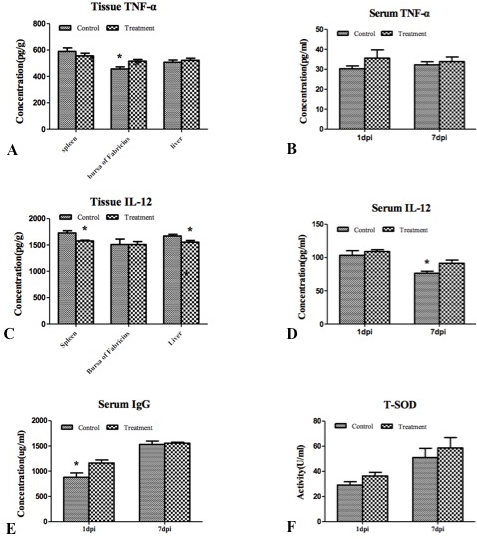
Fig. 1.
Changes in TNF-α, IL-12, and IgG concentrations and T-SOD activity. A, the tissue concentrations of TNF-α in control and treatment groups; B, the serum TNF-α levels in control and treatment groups; C, the tissue concentrations of IL-12 in control and treatment; D, the serum IL-12 concentration in control and treatment; E, the serum concentrations of IgG in control and treatment groups; F, the T-SOD activity of serums in control and treatment groups. The label “*” on each item indicates a significant difference between the different groups (P<0.05), n=6. “dpi” represents the days post injection of LPS.