
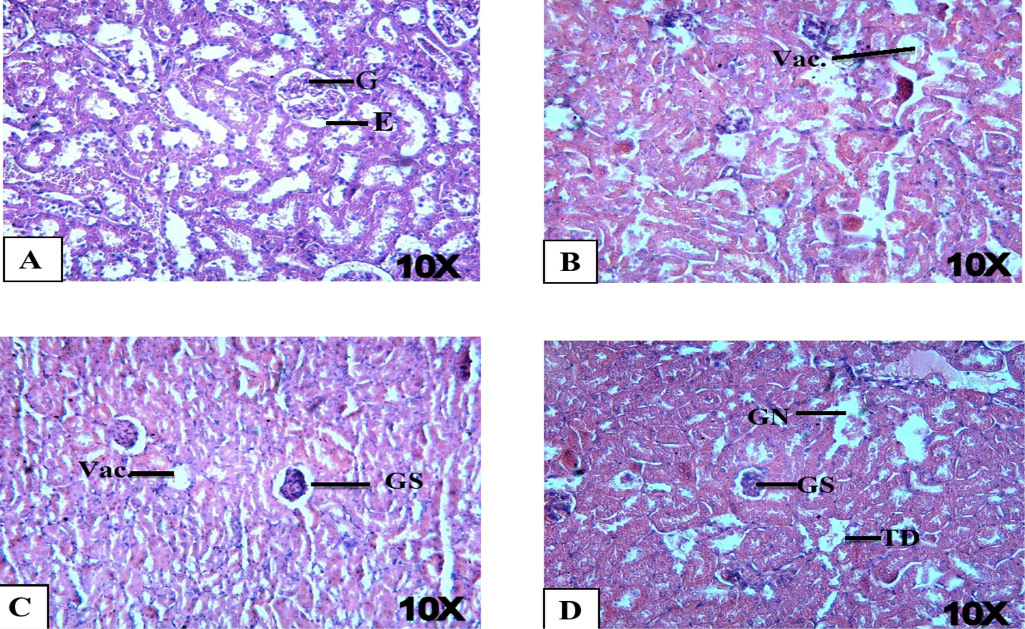
Figure 3:
Histopathological examination of mice kidneys with LFX at 10X. (A) Control mice showing normal tissues i.e. G: glomerulus; E: epithelial lining. (B) Mice treated with 9.37 μg/g B.W. of LFX showing Vac.: vacoulation. (C) Mice treated with 18.37 μg/g B.W. of LFX showing GS: gomerulosclerosis; Vac.: vacoulation. (D) Mice treated with 37.50 μg/g B.W. of LFX showing GS: glomerulonephritis; GN: glomerulonephritis; TD: tubular degeneration. Stain H and E.