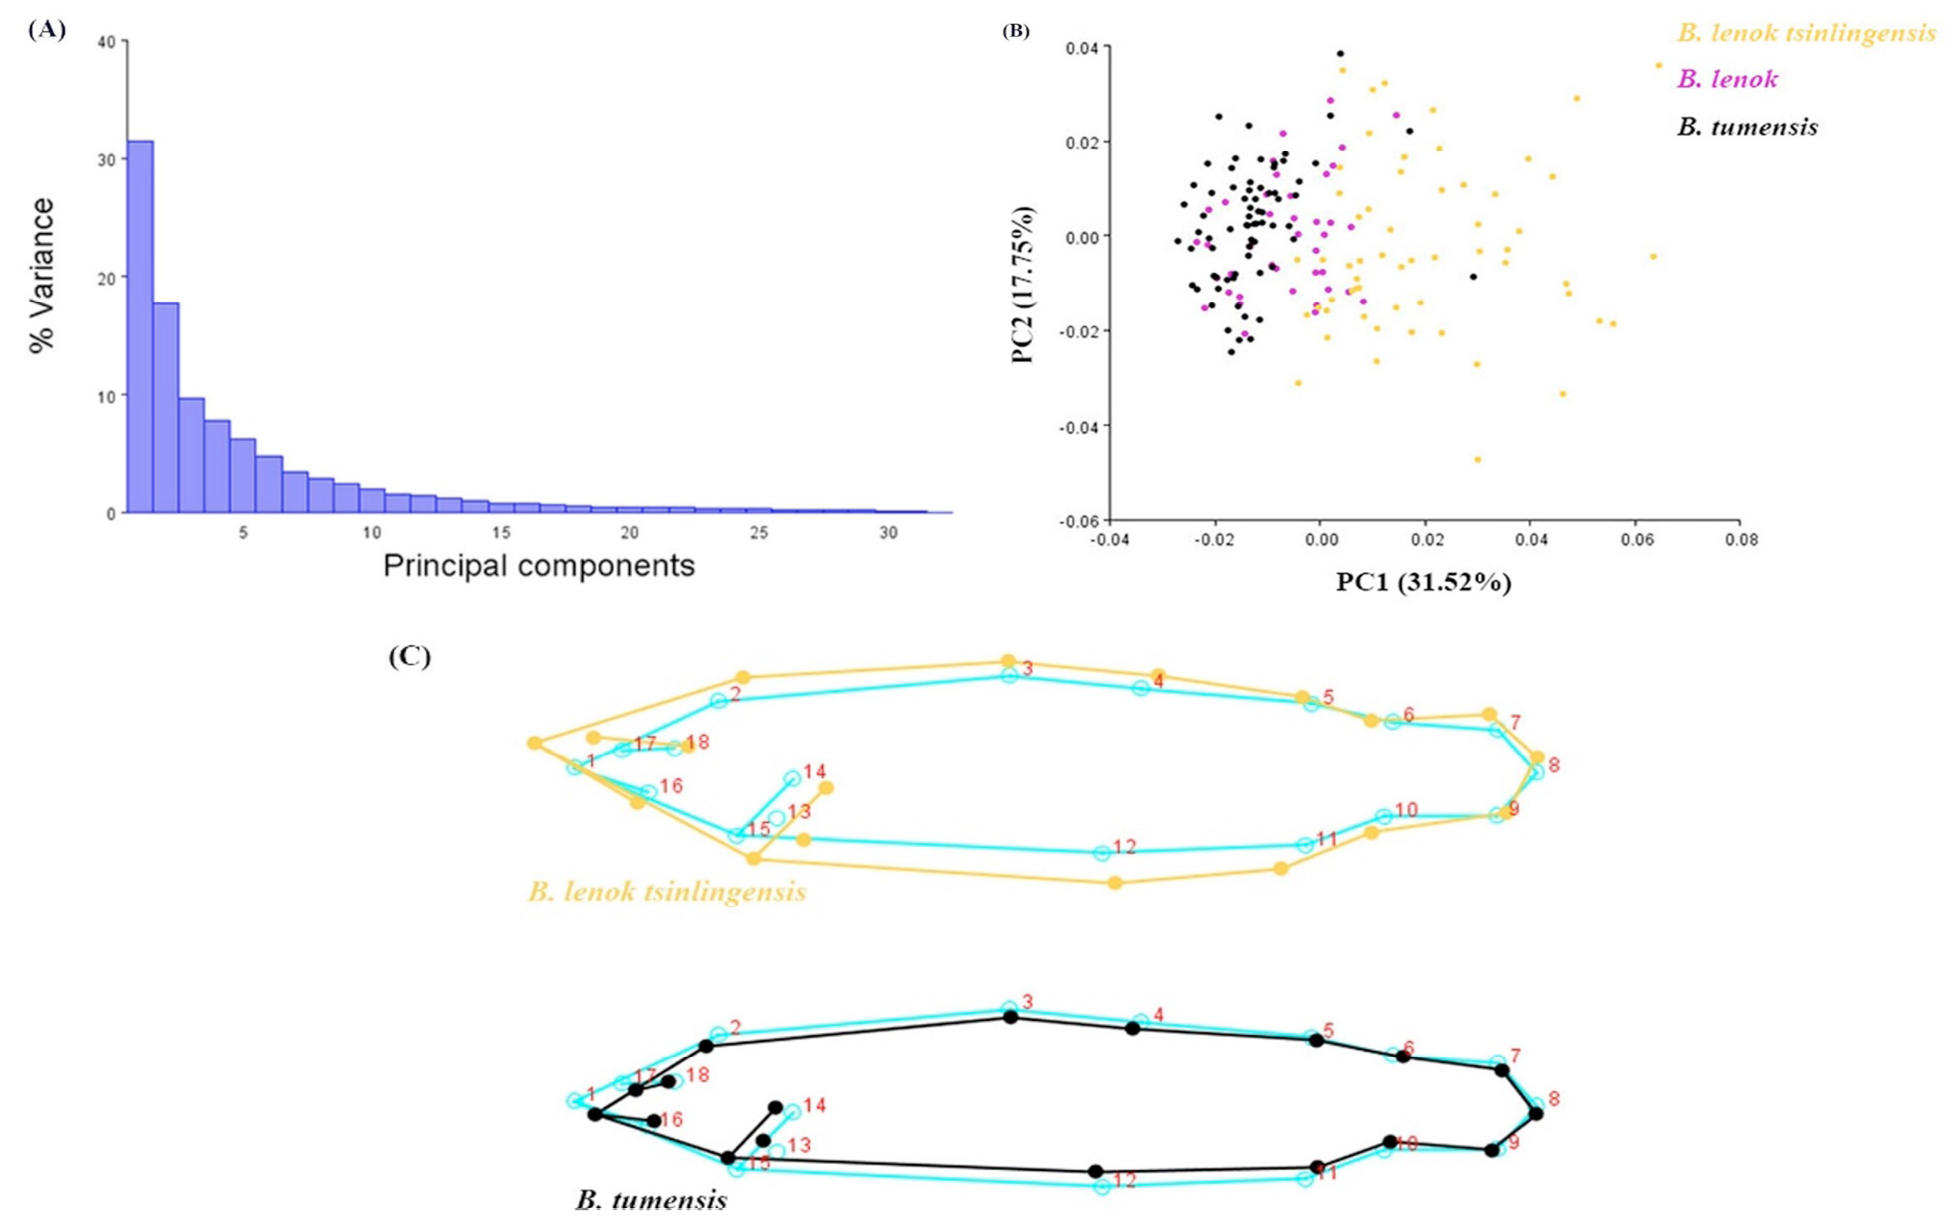
The results of principal component analysis for three morphotypes (B. lenok tsinlingensis, B. lenok and B. tumensis). A, Bar chart of percent variance explained by 32 principal components of geometric morphometric analysis, the first five PCs together account for 72.99% of the total variation; B, Scatterplot of principal components 1 and 2 from principal component analysis of Cartesian coordinates of 18 landmarks for all individuals (n= 169) among the three morphotypes (B. lenok tsinlingensis, B. lenok and B. tumensis); C, wireframes showing shape changes related to extremes of variation along the PC1 axes, the upper wireframes represented the shape variation of B. lenok tsinlingensis (scale factor = 0.08), the below wireframes represented the shape variation of B. tumensis (scale factor = -0.04).