
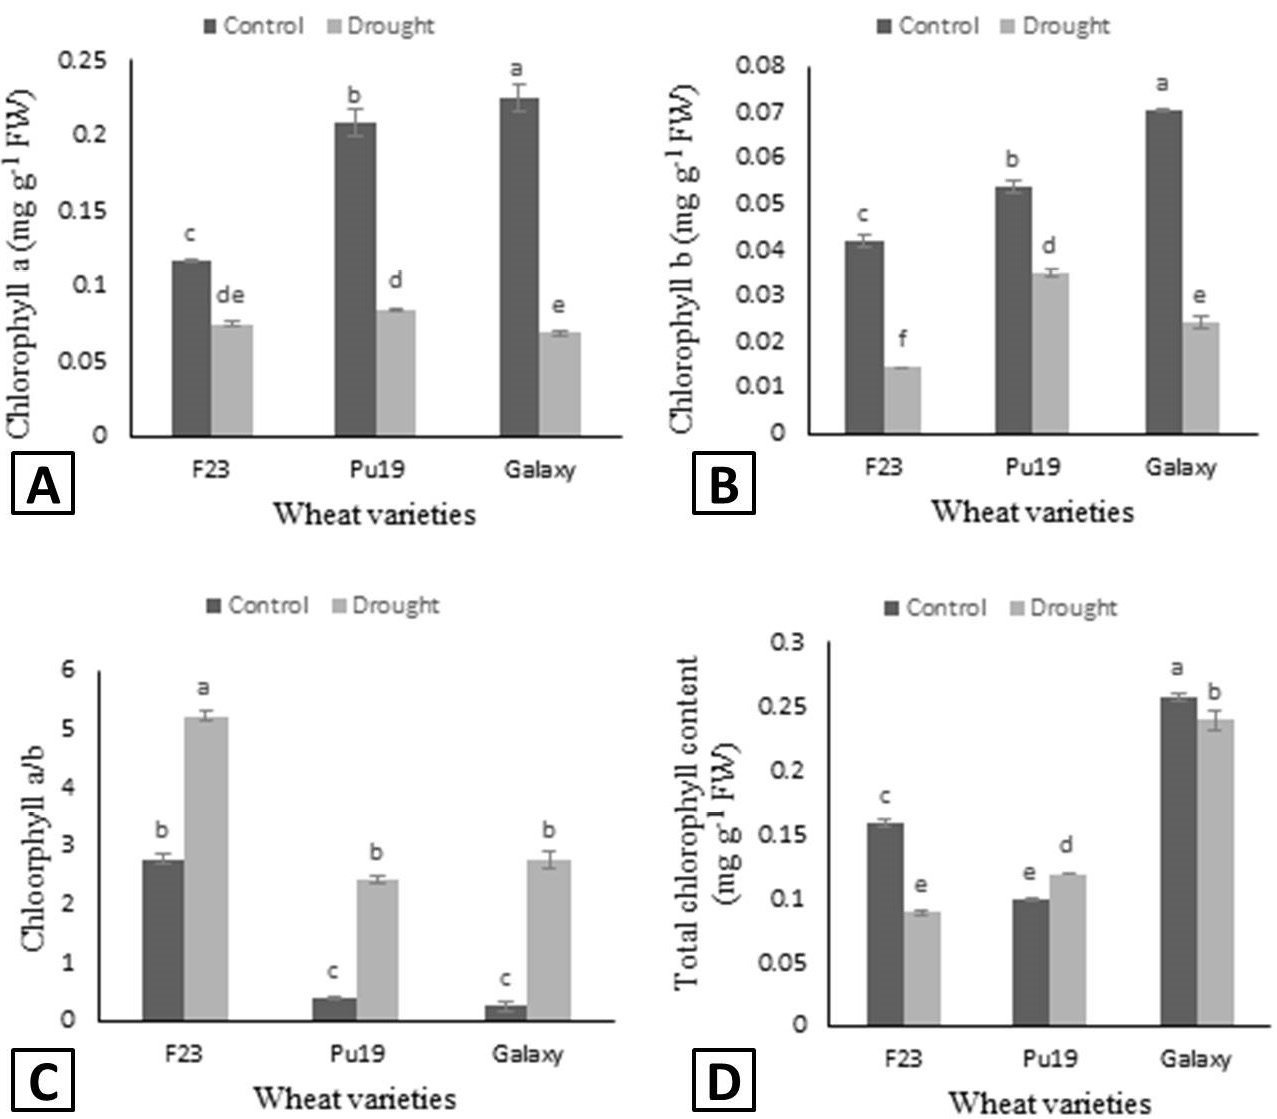
Figure 3:
Chlorophyll a (A), chlorophyll b (B), chlorophyll a/b (C) and total chlorophyll contents (D) of wheat varieties grown under control and drought condition. Different letters show the significant differences calculated by LSD at p<0.05. The data presented are mean values ± standard error of four replicates.