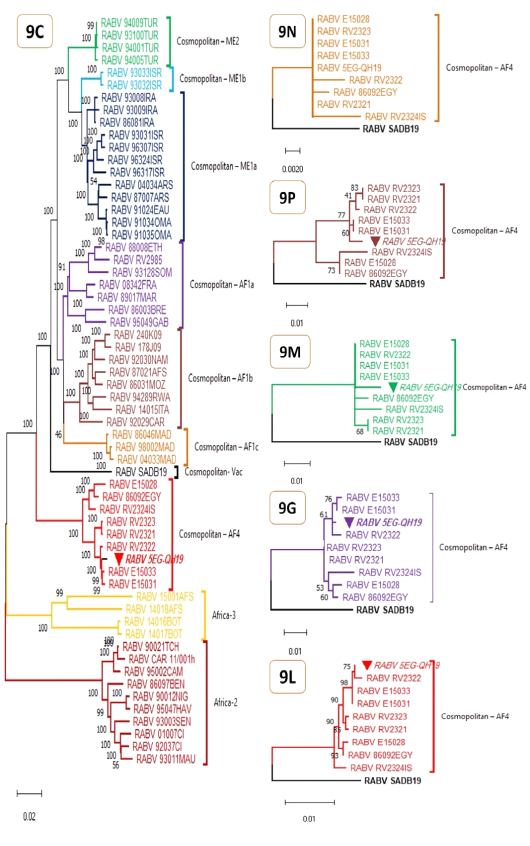
Maximum Likelihood phylogenetic analyses for complete RABV genomes (9C) and protein genes (9N, 9P, 9M, 9G, 9L). The evolutionary history was inferred by using Tamura-Nei model (Tamura and Nei 1993) for genomic tree (9C) or JTT matrix-based model (Jones et al. 1992) for protein genes (9N, 9P, 9M, 9G, 9L). The percentage of trees in which the associated taxa clustered together is shown next to the branches and is supported by 1K bootstrap test replicates for 9C and 100 bootstrap test replicates for 9N, 9P, 9M, 9G, and 9L. Initial tree(s) were obtained automatically by applying Neighbor-Join and BioNJ algorithms to a matrix of pairwise distances estimated using either the Tamura-Nei model or the JTT model, and then the topology with superior log likelihood value is selected. The trees are drawn to scale, with branch lengths measured in the number of substitutions per site. All trees are midpoint rooted and clade/ lineage name is shown right to clusters. These analyses involved 60 nucleotide sequences (table S1) and 11740 positions (9C), or 10 amino acid sequences and 450, 279, 202, 524, and 2127 positions for 9N, 9P, 9M, 9G, and 9L respectively. The studied genome and its genes are marked with inverted solid triangle. Evolutionary analyses were conducted in MEGA11 (Tamura et al. 2021).
