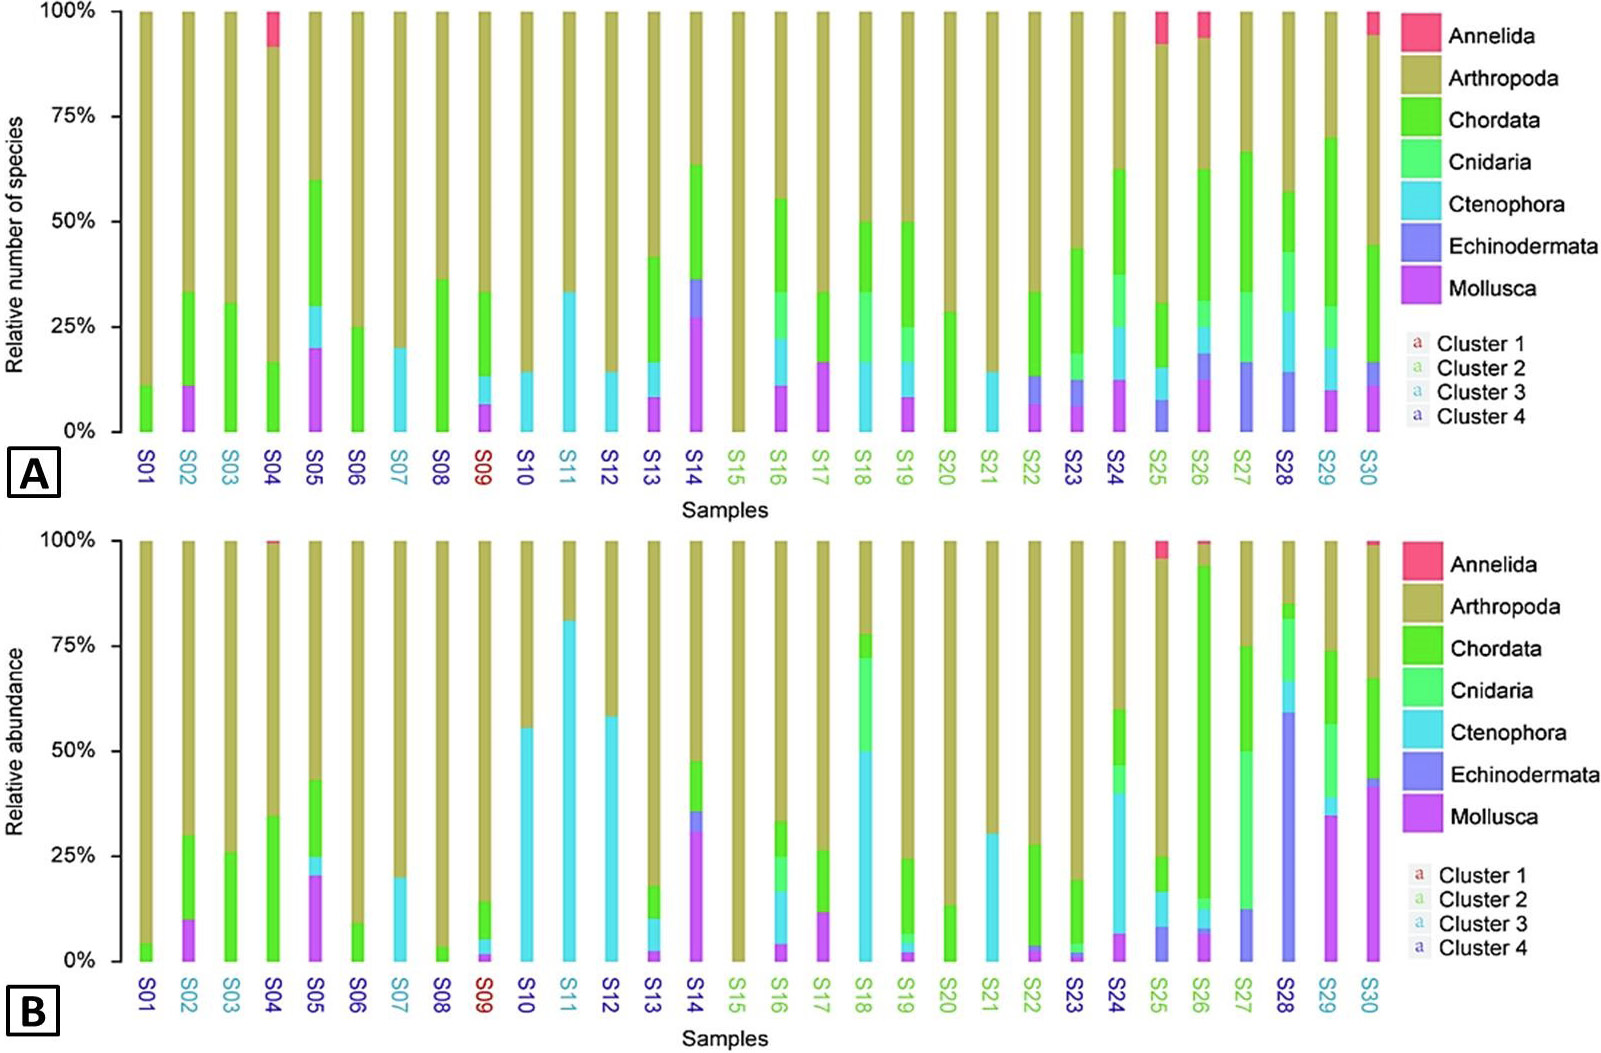
The relative number of species (A) and the relative abundance of taxonomic groups (B) in every sampling stations.
