
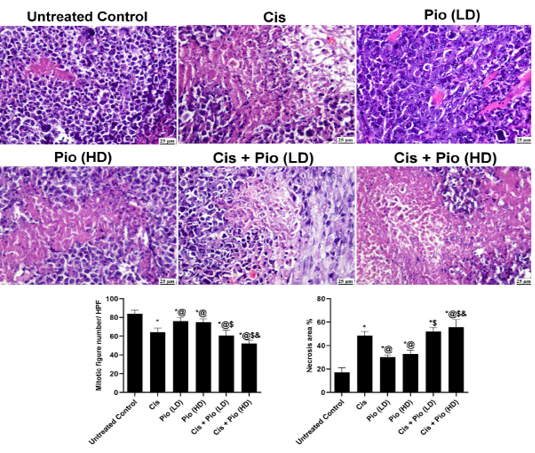
Figure 7
Histological sections stained with H&E showing the examined tumor mass in different groups.. The column charts illustrating the average of mitotic figure number/10 HPF and the necrosis area % in different groups. Data are expressed as mean ± SD, one-way ANOVA followed by post hoc test Bonferroni. * Significant from the untreated control group, @ Significant from the cisplatin group, $ Significant from the Pio (LD) group, and & Significant from the Cis+ Pio (LD) group, p<0.05.