
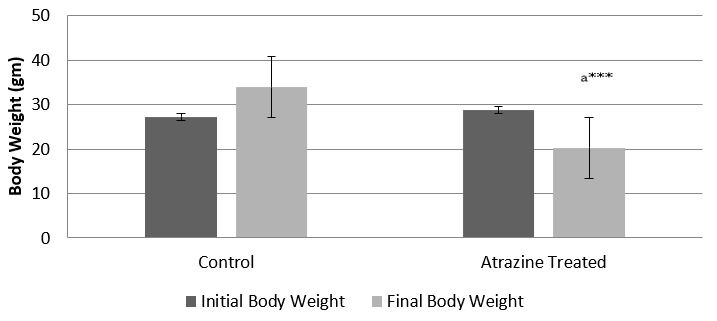
Figure 3:
Mean body weight of male albino mice belonging to Cnt and ATZ treated groups. Values are expressed in Mean ± SEM. a=Cnt group vs ATZ treated group. ***p ˂ 0.001.
Mean body weight of male albino mice belonging to Cnt and ATZ treated groups. Values are expressed in Mean ± SEM. a=Cnt group vs ATZ treated group. ***p ˂ 0.001.