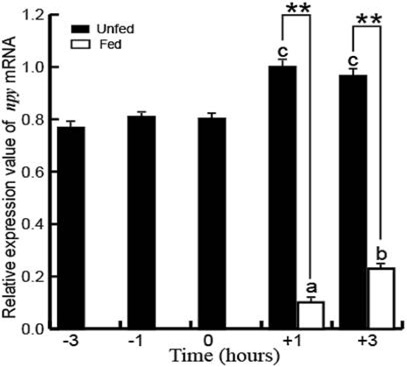
Fig. 5.
Postprandial changes in npy mRNA expression in the hypothalamus of gibel carp. The preprandial (-3, -1 and 0 h) and postprandial groups (+3 and +1 h) that differed significantly are indicated by different letters above the bars. Asterisks represent significant differences between the fed and unfed groups at the same time point. **P < 0.01.