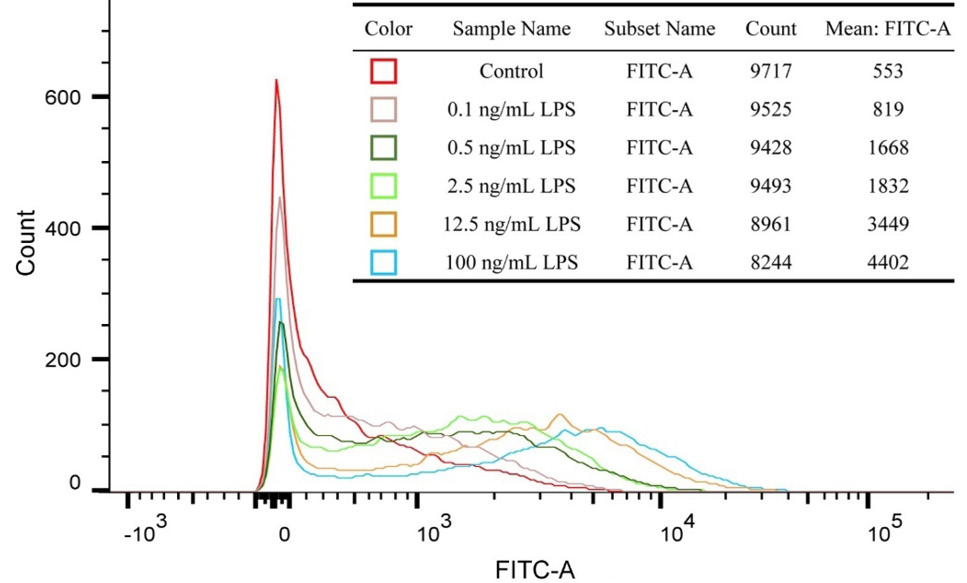
Fig. 2.
Effects of different LPS levels on the cellular ROS production in MAC-T cells. The representative flow cytometric results are showed in the histogram, and the line color and its corresponding sample name, total cell count, and mean fluorescence intensity are showed in the upper right table. Mean fluorescein isothiocyanate-A (FITC-A) values represent ROS concentrations.