
Fig. 3.
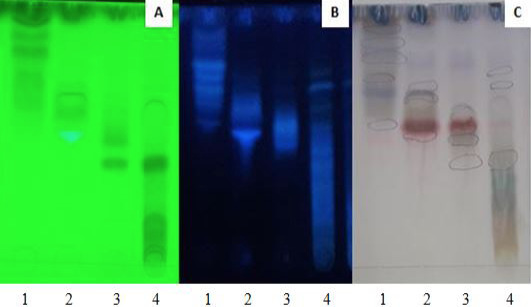
Metabolic fingerprints of actinobacterial strains on TLC plates (A) under UV at 254 nm (B) under UV at 366nm (C) after treatment with anisaldehyde/H2SO4.
Metabolic fingerprints of actinobacterial strains on TLC plates (A) under UV at 254 nm (B) under UV at 366nm (C) after treatment with anisaldehyde/H2SO4.