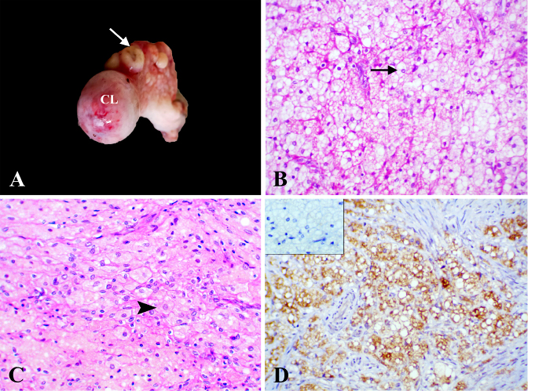
Figure 4
Steroid cell tumor, NOS, ovary, camel. (A) Firm grayish white to yellow nodules (arrow) CL; corpus luteum. (B) Neoplastic cells had marked amounts of foamy or clear cytoplasm (arrow), HE x 400. (C) Neoplastic cells had eosinophilic or yellowish-pigmented cytoplasm (arrowhead), HE x 400. (D) Neoplastic cells expressed cytoplasmic positive reaction for melan A, x 400. Inset, negative reaction for inhibin, x 400.