
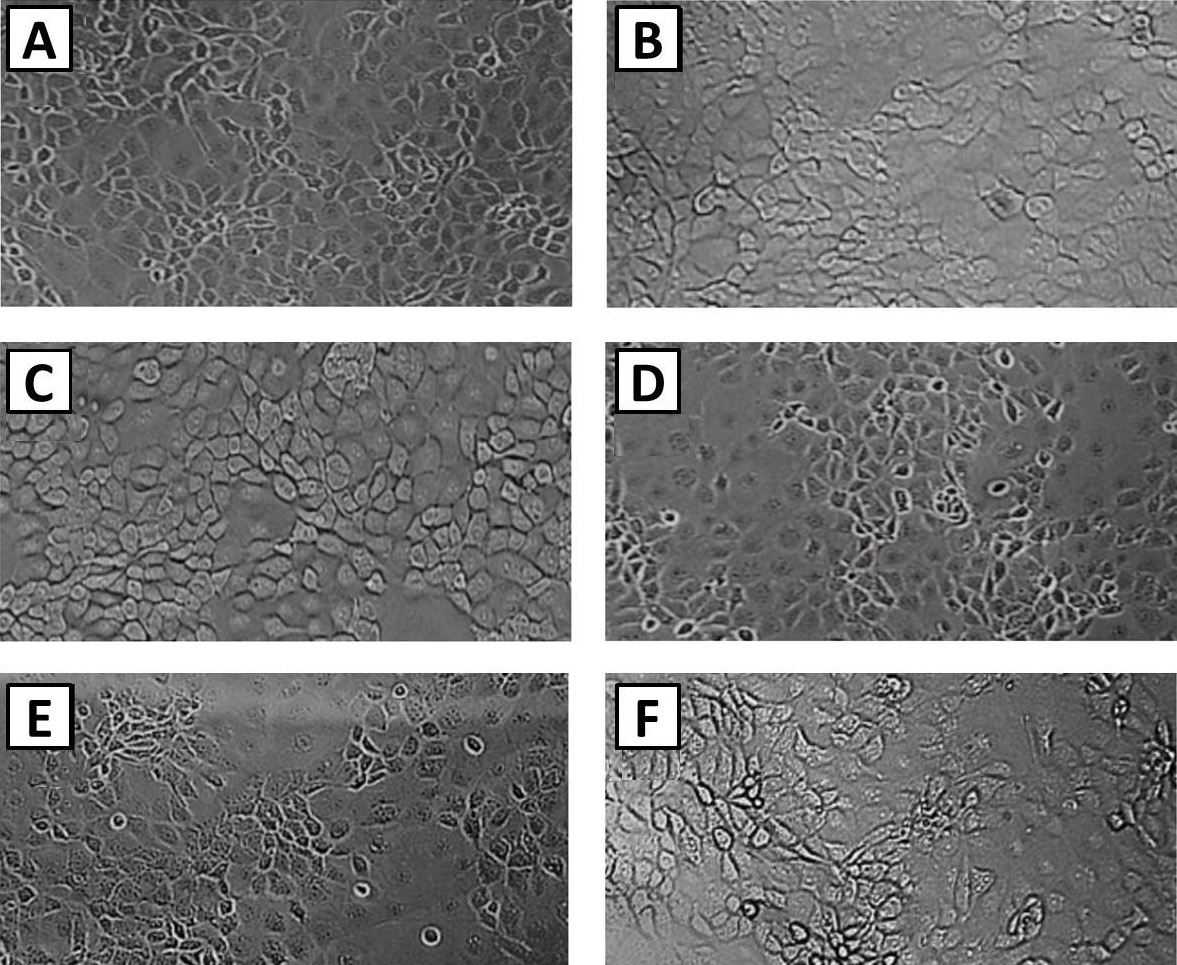
Fig. 1.
Cell morphology of IPEC-1 after 24 h of culture with different CT levels (×100). A, control group (no CT); B, 1×10-12 mol/L CT treated; C, 1×10-11 mol/L CT treated; D, 1×10⁻¹⁰ mol/L CT treated; E, 1×10⁻⁹ mol/L CT treated; F, 1×10⁻⁸ mol/L CT treated.