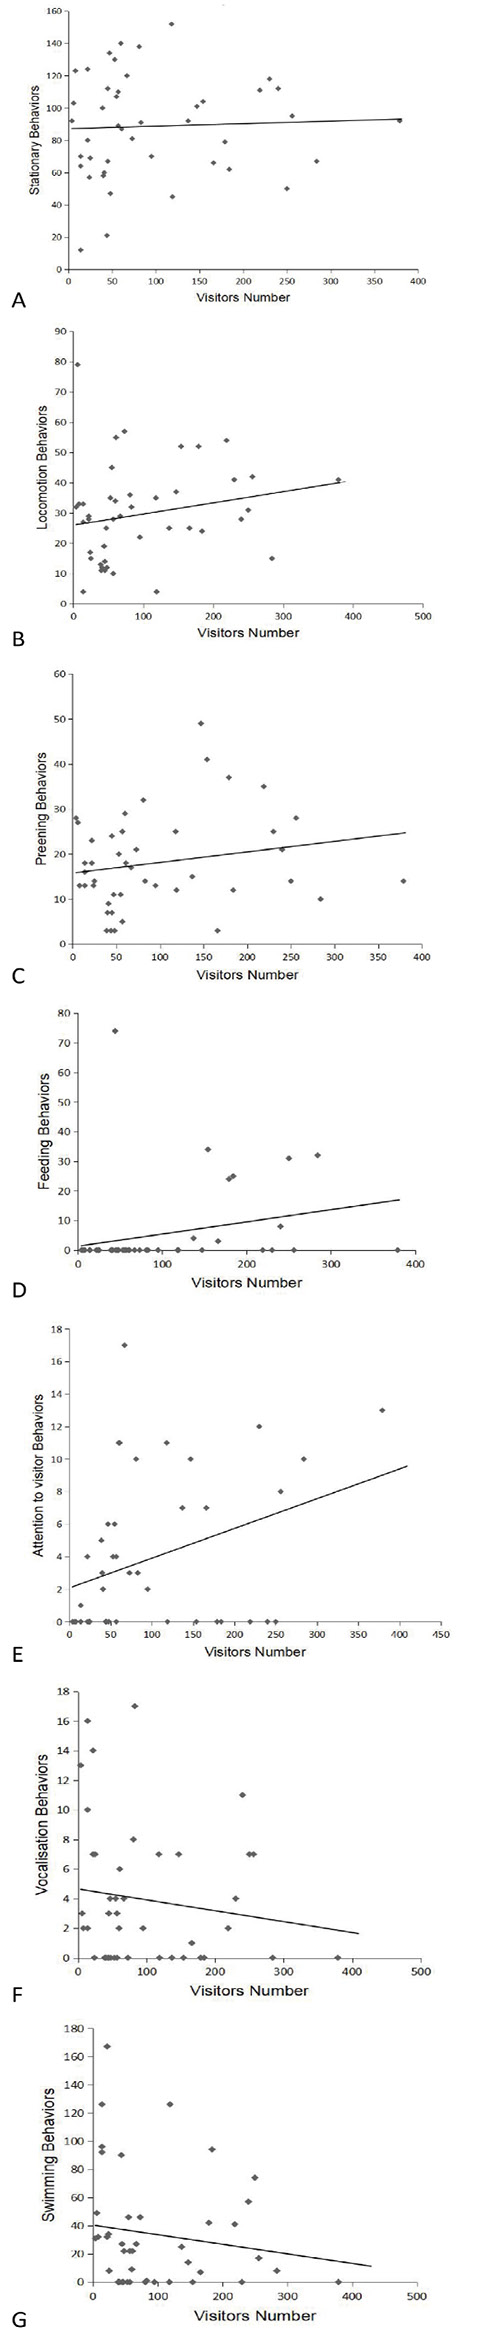
Fig. 6.
Scatterplots of effect of visitor numbers on penguin behavior. The x-coordinate of each point is the number of visitors in a given hour, and the y-coordinate is the incidence of a given behavior in the same hour. The mean behavior values are based on scan data from each hour (n= 44h).