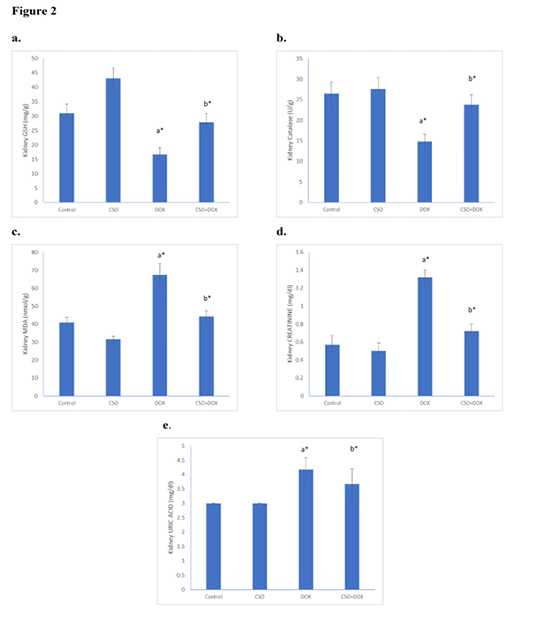
Figure 2
Effect of CSO on kidney GSH (a) CAT (b) and MDA (c) in different rat groups, concentration of creatinine enzyme (d) and uric acid (e) in serum of different rat groups. Data are expressed as mean ± SE. Treated Groups showed a significance as compared to a control and b compared to DOX (*P<0.05).