
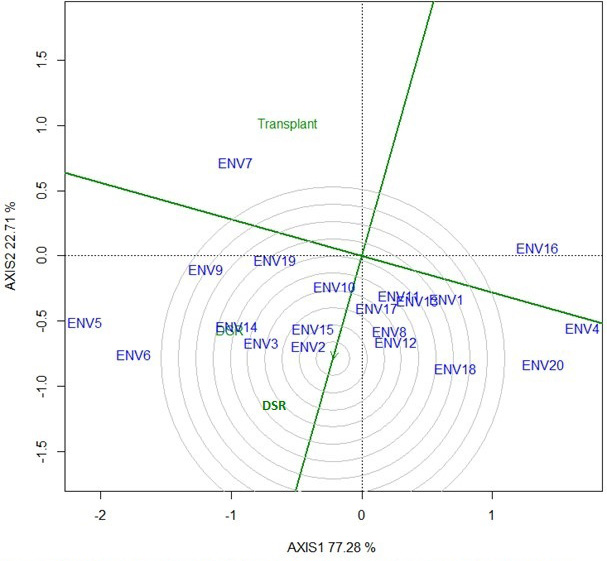
Figure 2
GGE biplot analysis on the basis of paddy yield where X-axis shows principal component 1 (DSR) and Y-axis indicateds principal component 2 (transplanting). If the total variation is 100% then contribution due to DSR is 77.28% and owing to transplanting is 22.71%. The ENVI (environment), ENV2 correspond to location 1, Location 2, referred Table 3.