
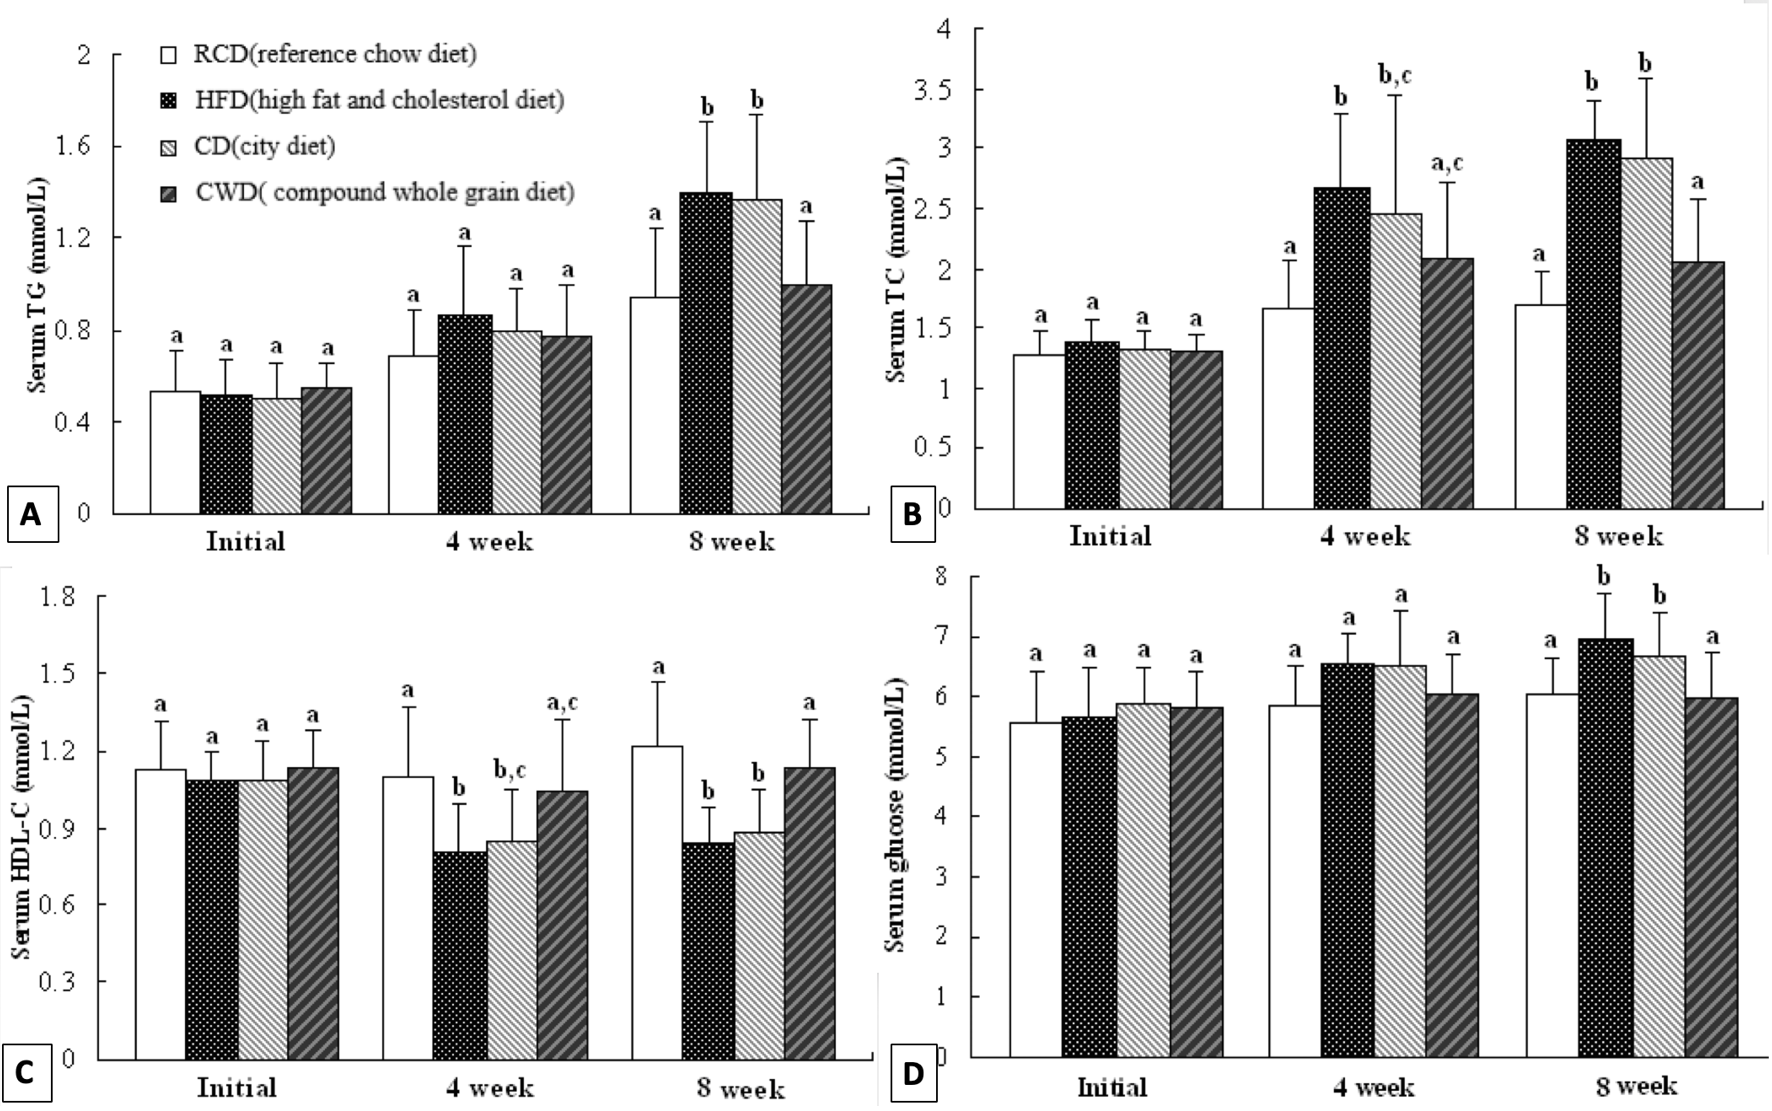
Fig. 1.
Effect of compound whole-grain on serum lipid profiles and glucose levels in rats fed high-fat/cholesterol diet. Each value represents the means with their standard deviations for ten animals (n = 10 for each group). Bars without a common superscript letter indicate significant differences among groups (P<0.05). (A), TG, triacylglycerol; (B), TC, total cholesterol; (C), HDL-C, high-density lipoprotein cholesterol; (D), glucose. For abbreviations, see Table I.