
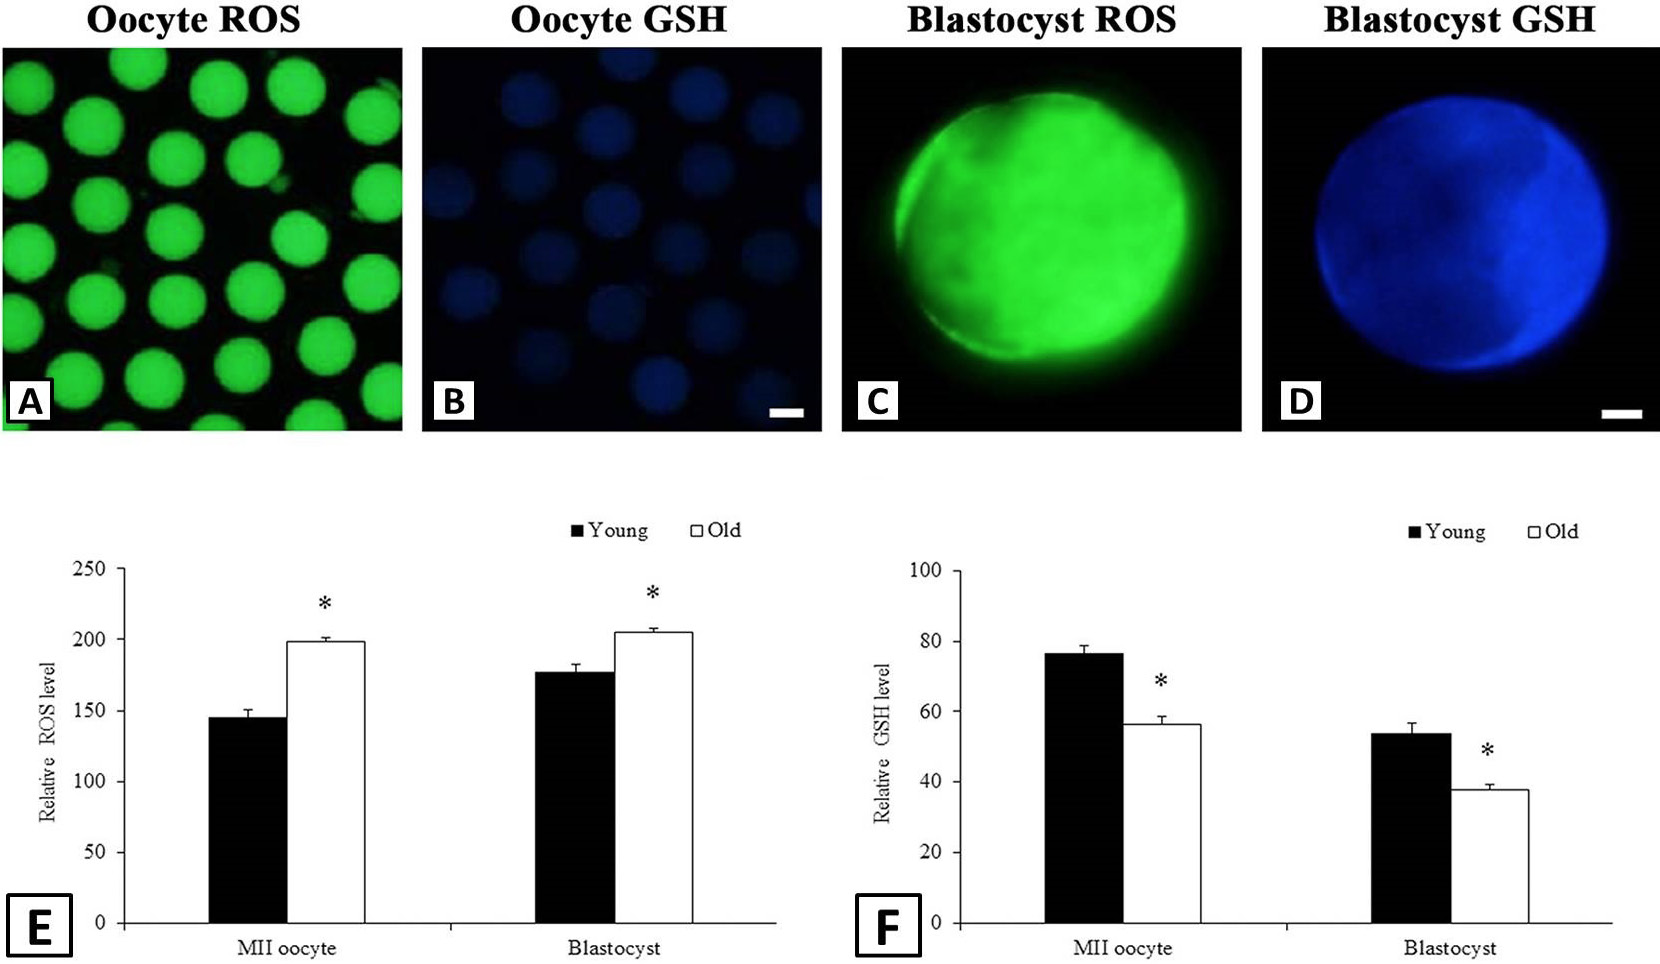
Fig. 3.
Intracellular ROS and GSH levels in MII oocytes and blastocysts. Shown were representative images of ROS (A) and GSH (B) in MII oocytes. C and D were the representative images of ROS and GSH, respectively in blastocysts. The quantitative results from fluorescence intensities of ROS (E) and GSH (F) in MII oocytes and blastocysts, respectively. At least 25 MII oocytes or blastocysts were analysed for each treatment per group. Scale bar is 50 μm in A and B and 20 μm in C and D.