
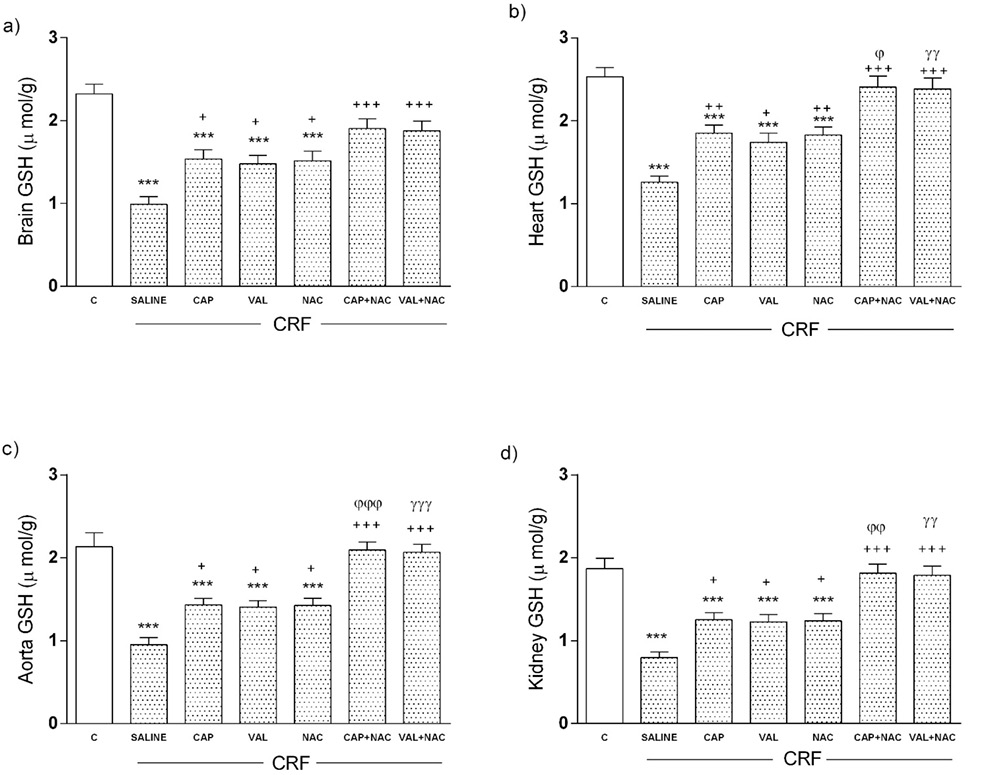
Fig. 3.
Glutathione (GSH) levels in the a) brain, b) heart, c) aort and d) kidney tissues in chronic renal failure (CRF). Control (C), Saline (SF) treated, Captopril (CAP) treated, Valsartan (VAL) treated, N-acetyl-L-cysteine (NAC) treated, CAP+NAC treated, VAL+NAC treated CRF groups. *** p <0.001 compared with control, + p<0.05, ++ p<0.01, +++ p<0.001 compared with SF treated CRF group, φ p<0.05, φφ p<0.01, φφφ p<0.001 compared with CAP treated CRF group, γγ p<0.01, γγγ p<0.001 compared with VAL treated CRF group.