
Figure 8
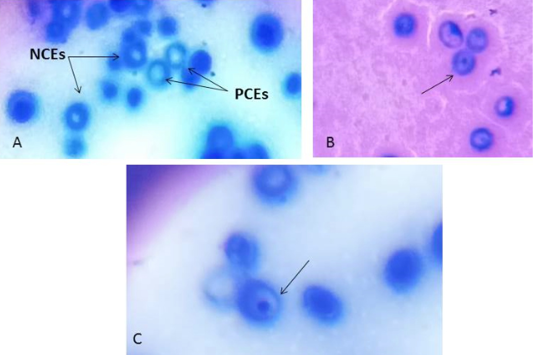
Microphotographs of polychromatic erythrocytes and normochromatic erythrocytes in control rats (A), polychromatic erythrocyte micronucleus in S/DM Nps administered rats(B) and CS/DM Nps (C).
Microphotographs of polychromatic erythrocytes and normochromatic erythrocytes in control rats (A), polychromatic erythrocyte micronucleus in S/DM Nps administered rats(B) and CS/DM Nps (C).