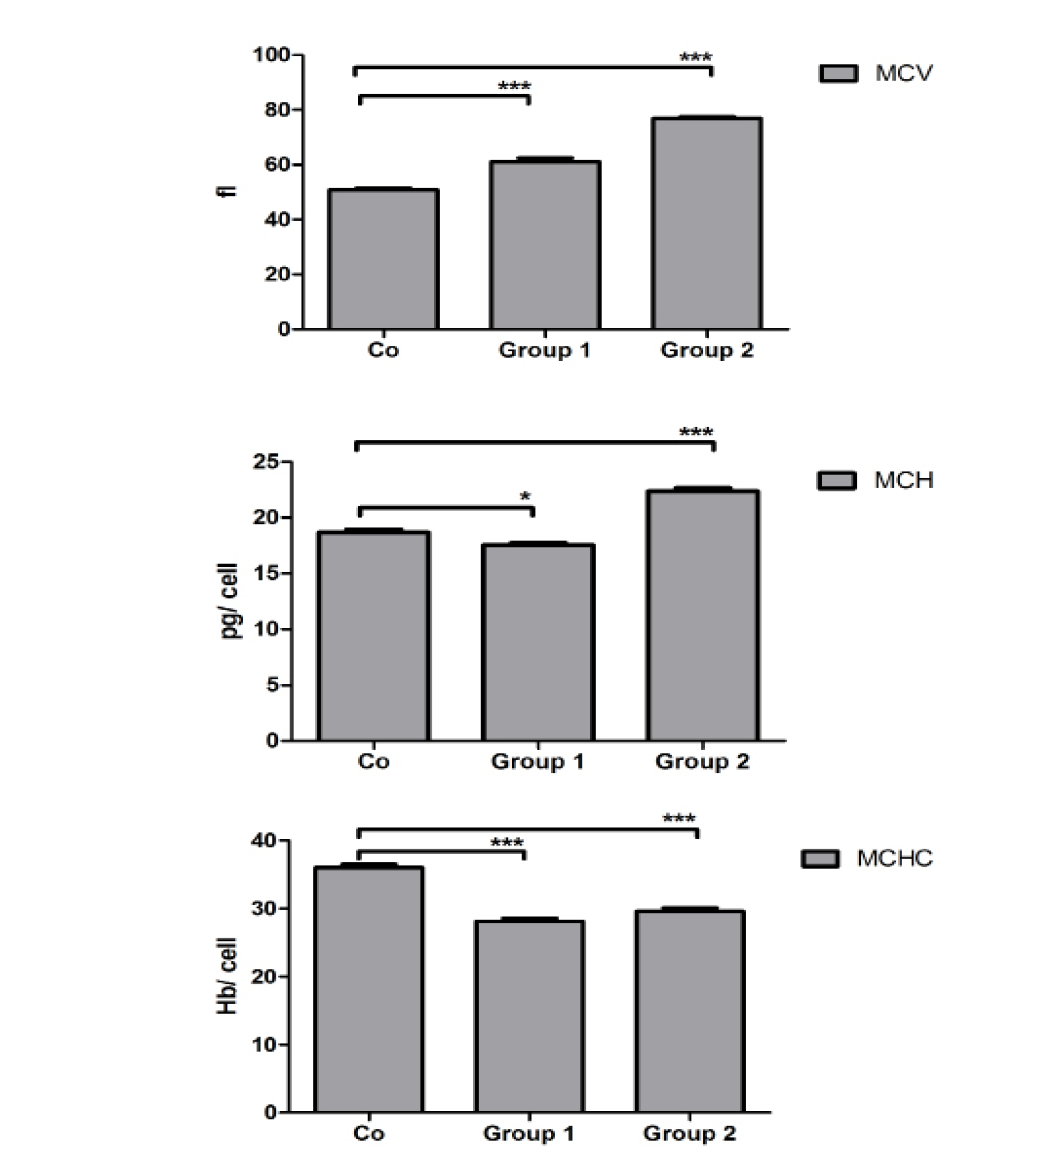
Figure 5:
Level of MCV, MCH and MCHC in blood. MCV level was found to be increased significantly (P<0.0001) in both studied groups as compared to the control. Level of MCH (P<0.0001) was decreased significantly in Group 1 against control while Group 2 showed opposite trend to Group 1. Regarding MCHC (P<0.0001) both experimental groups showed a significant negative trend against control. The results are representative of three animal series (mean ± S.E.M.).