
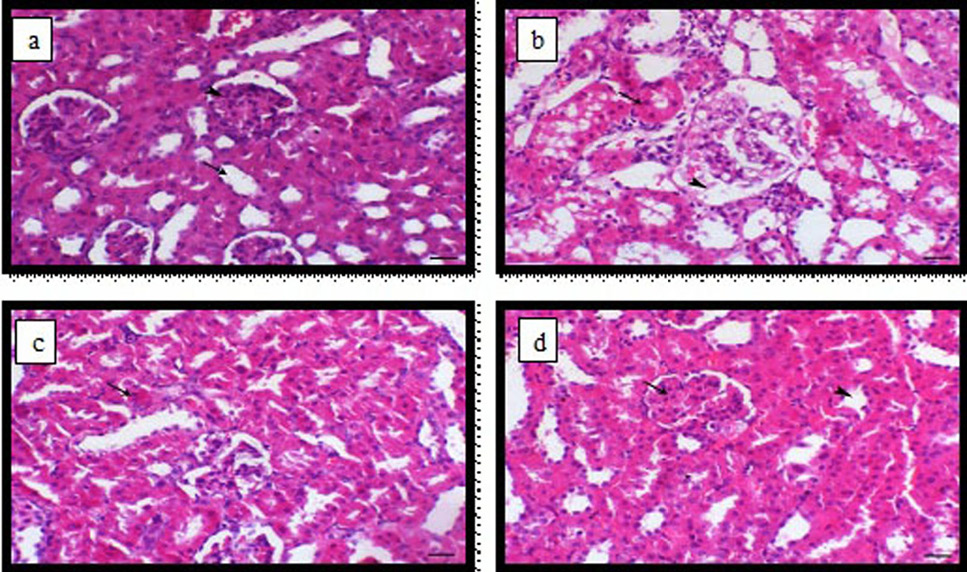
Fig. 6.
Light micrograph of kidney, (a) control animal showing normal renal glomeruli and tubules (arrow head and arrow respectively); (b) PAT-treated animal showing congestion of the glomerular tufts with oedema of the Bowman’s space (arrowhead) and degenerative changes within the renal tubular epithelium (arrow); (c) PAT and ginger-treated animal for 4 weeks showing mild to moderate degenerative changes within renal tubular epithelium (arrow) and (d) PAT and ginger treated animal for 8 weeks showing normal renal glomeruli and tubules (arrow and arrowhead respectively), Haemotoxylin and Eosin stain, bar= 40 µm.