Figure 2
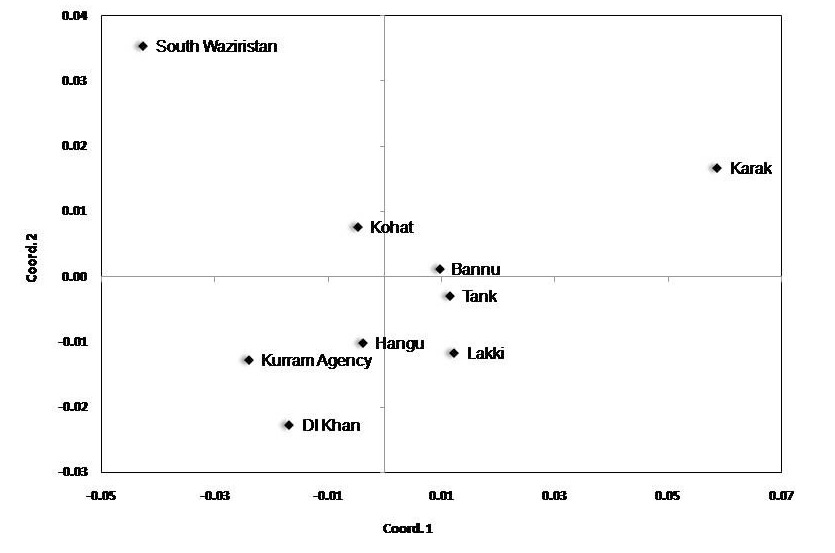
Scatter plot depicting the output of Principal Component Analysis based on genetic distance matrix in the Pashtun populations.
Scatter plot depicting the output of Principal Component Analysis based on genetic distance matrix in the Pashtun populations.