Fig. 1.
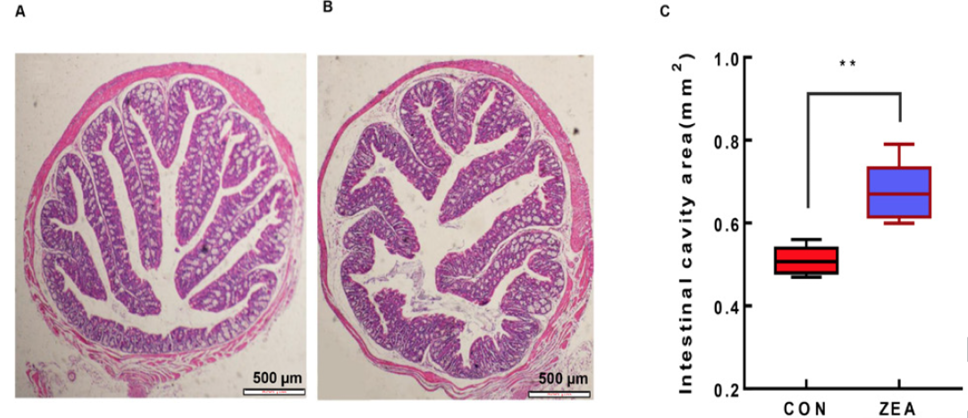
The effect of ZEA on the intestinal mucosal morphology of the colon in BALB/C mice. A: The colon of the CON group. B: The colon of the ZEA group. C: The area of intestinal cavity. **: P value<0.01.
The effect of ZEA on the intestinal mucosal morphology of the colon in BALB/C mice. A: The colon of the CON group. B: The colon of the ZEA group. C: The area of intestinal cavity. **: P value<0.01.