Figure 2
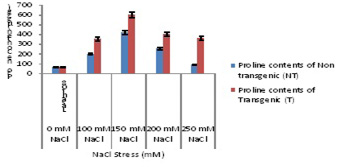
Comparison of proline contents (µg/ g FW) of T2 transgenic and non-transgenic wheat plants under salt stress. Vertical bars indicate standard error of means (n=3).
Comparison of proline contents (µg/ g FW) of T2 transgenic and non-transgenic wheat plants under salt stress. Vertical bars indicate standard error of means (n=3).