Fig. 3.
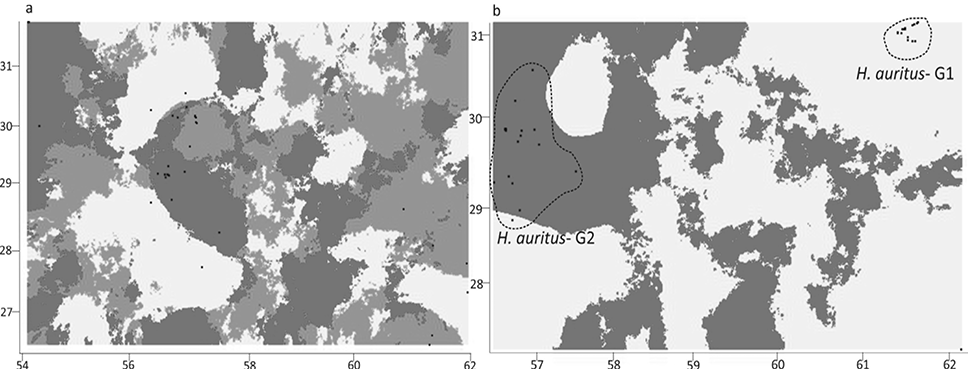
Mosaic map of spatial distribution of genetic groups in H. hypomelas (a) and H. auritus (b) based on Bayesian clustering algorithm in Geneland. The black spots indicate the geographic location of the samples.
Mosaic map of spatial distribution of genetic groups in H. hypomelas (a) and H. auritus (b) based on Bayesian clustering algorithm in Geneland. The black spots indicate the geographic location of the samples.