View larger version:
Download Original File
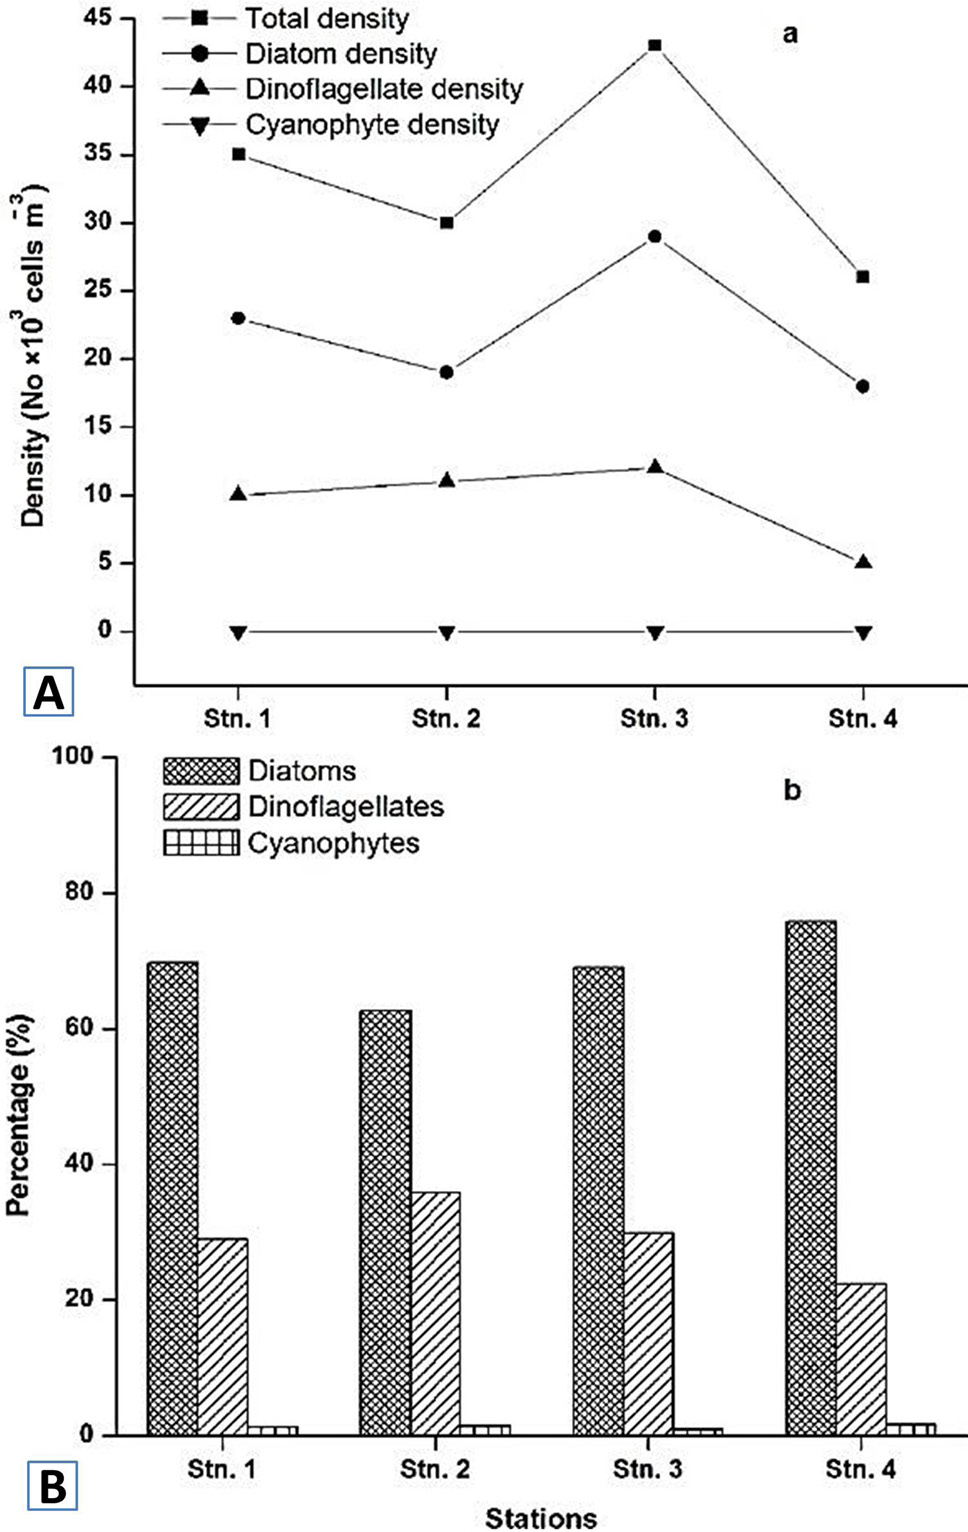
Fig. 4.
Abundance (A) and percentage (B) of different phytoplankton groups observed during the study period.
