View larger version:
Download Original File
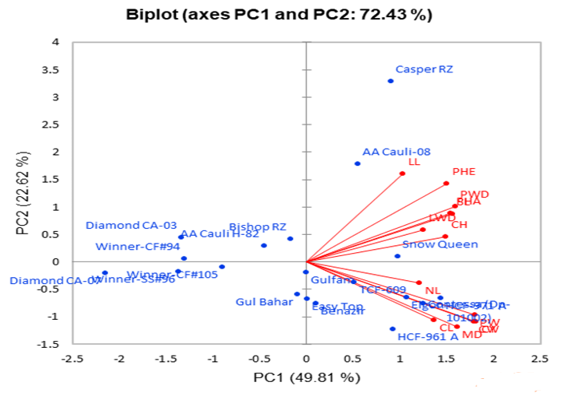
Figure 2:
Biplot among first two PCs representing genetic diversity.
