
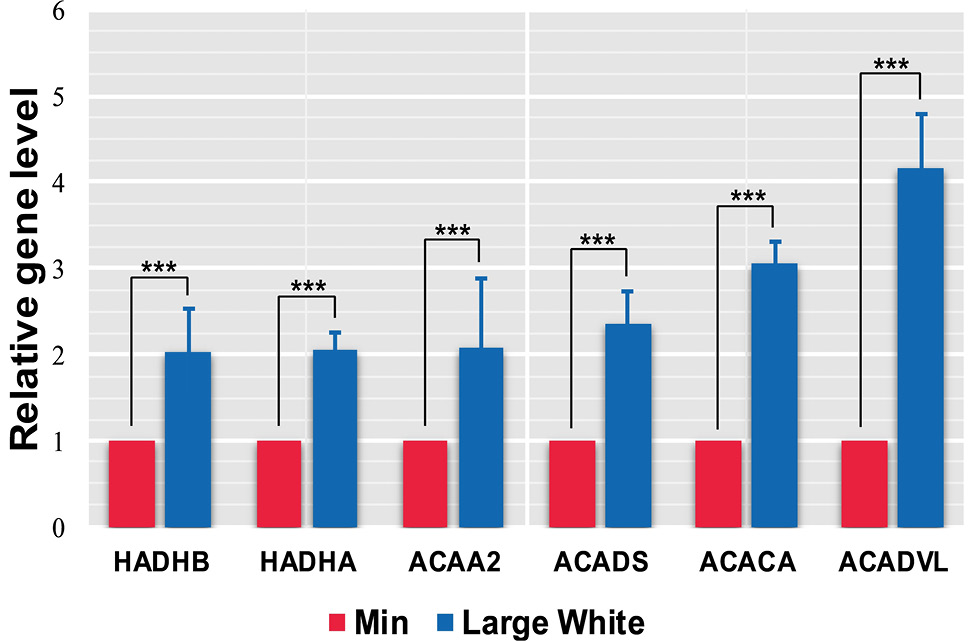
Fig. 8.
Comparisons of the expression levels of six key hub genes (ACACA, ACAA2, ACADS, ACADVL, HADHA and HADHB) in the fatty acid metabolism signaling pathway in the two pig breeds. A p value less than 0.05 and |logFold Change(FC)| ≥1 were regarded as the cutoff thresholds for DEGs. All data are shown as means ± SEM (n=3), ***P<0.001.