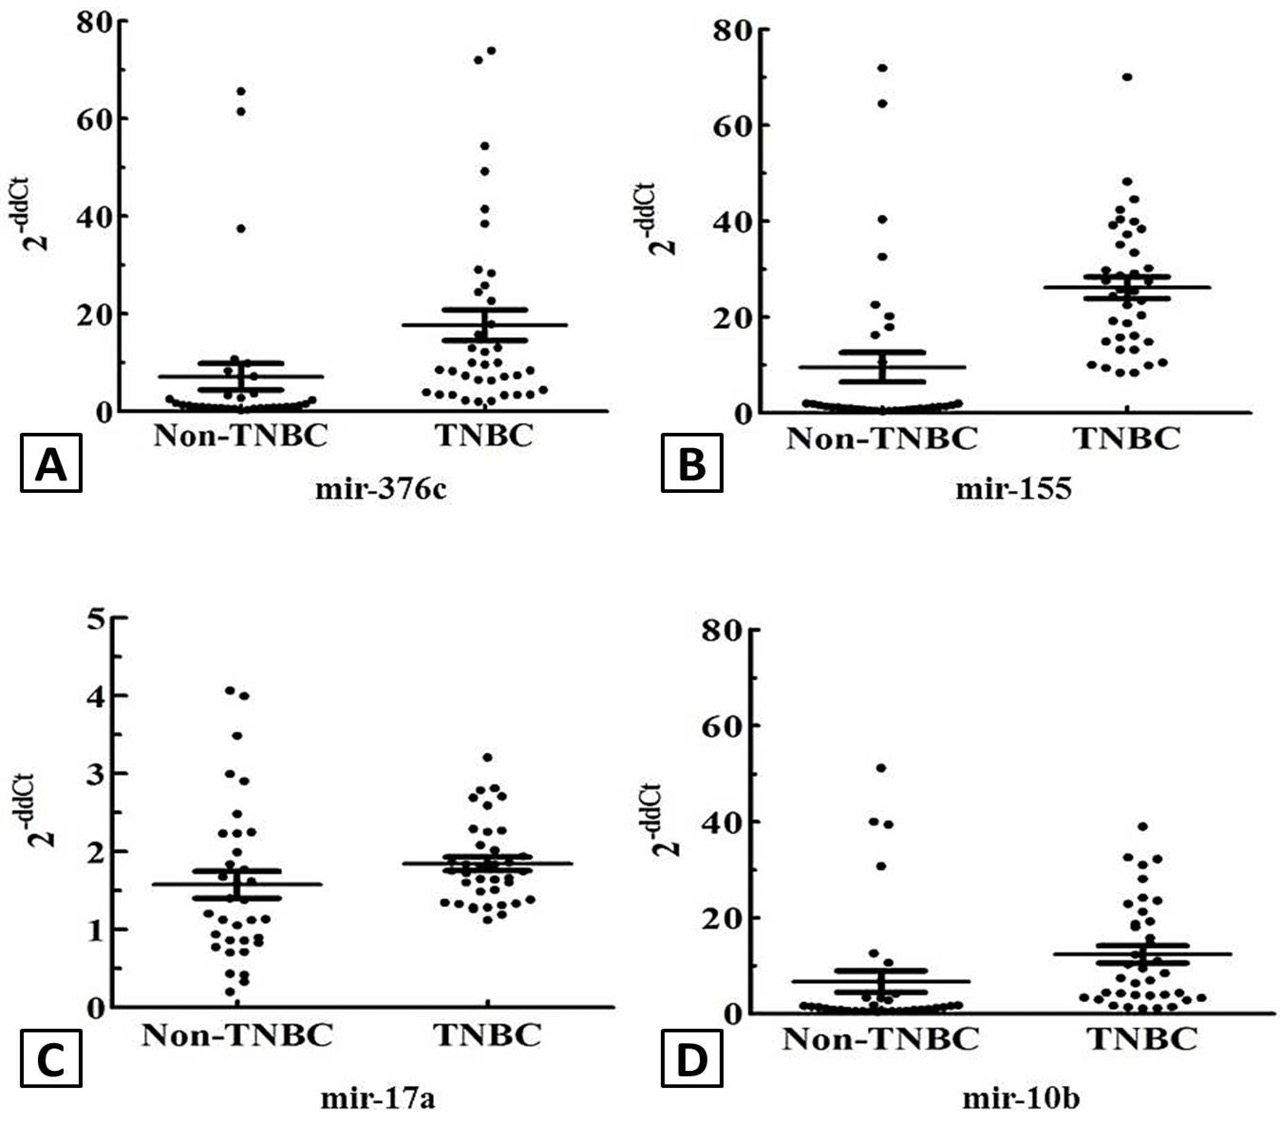
Fig. 1.
Scatter plots are representing high expression fold change in mir-376c, mir-155, mir-17a and mir-10b with significant p-value (p< 0.05).
Scatter plots are representing high expression fold change in mir-376c, mir-155, mir-17a and mir-10b with significant p-value (p< 0.05).