
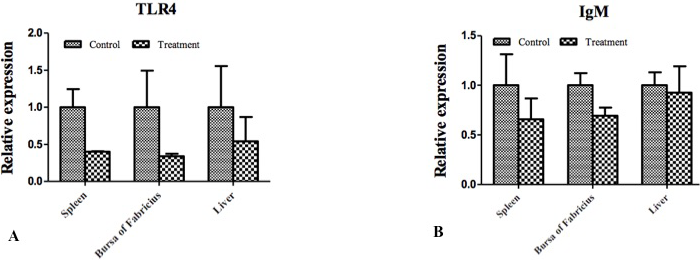
Fig. 2.
Changes in TLR4 and IgM mRNA expression in tissues. Panel A & B show the relative expression of TLR4 and IgM, respectively, in liver, spleen and bursa of Fabricius between control and treatment groups. The label “*” on each item indicates a significant difference between the different groups (P<0.05), n=4