View larger version:
Download Original File
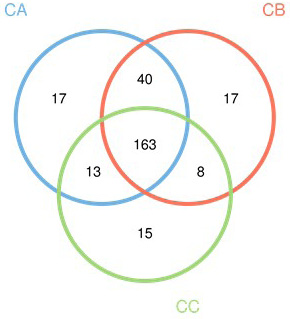
Fig. 2.
OTUs distribution in community level in venn diagram.