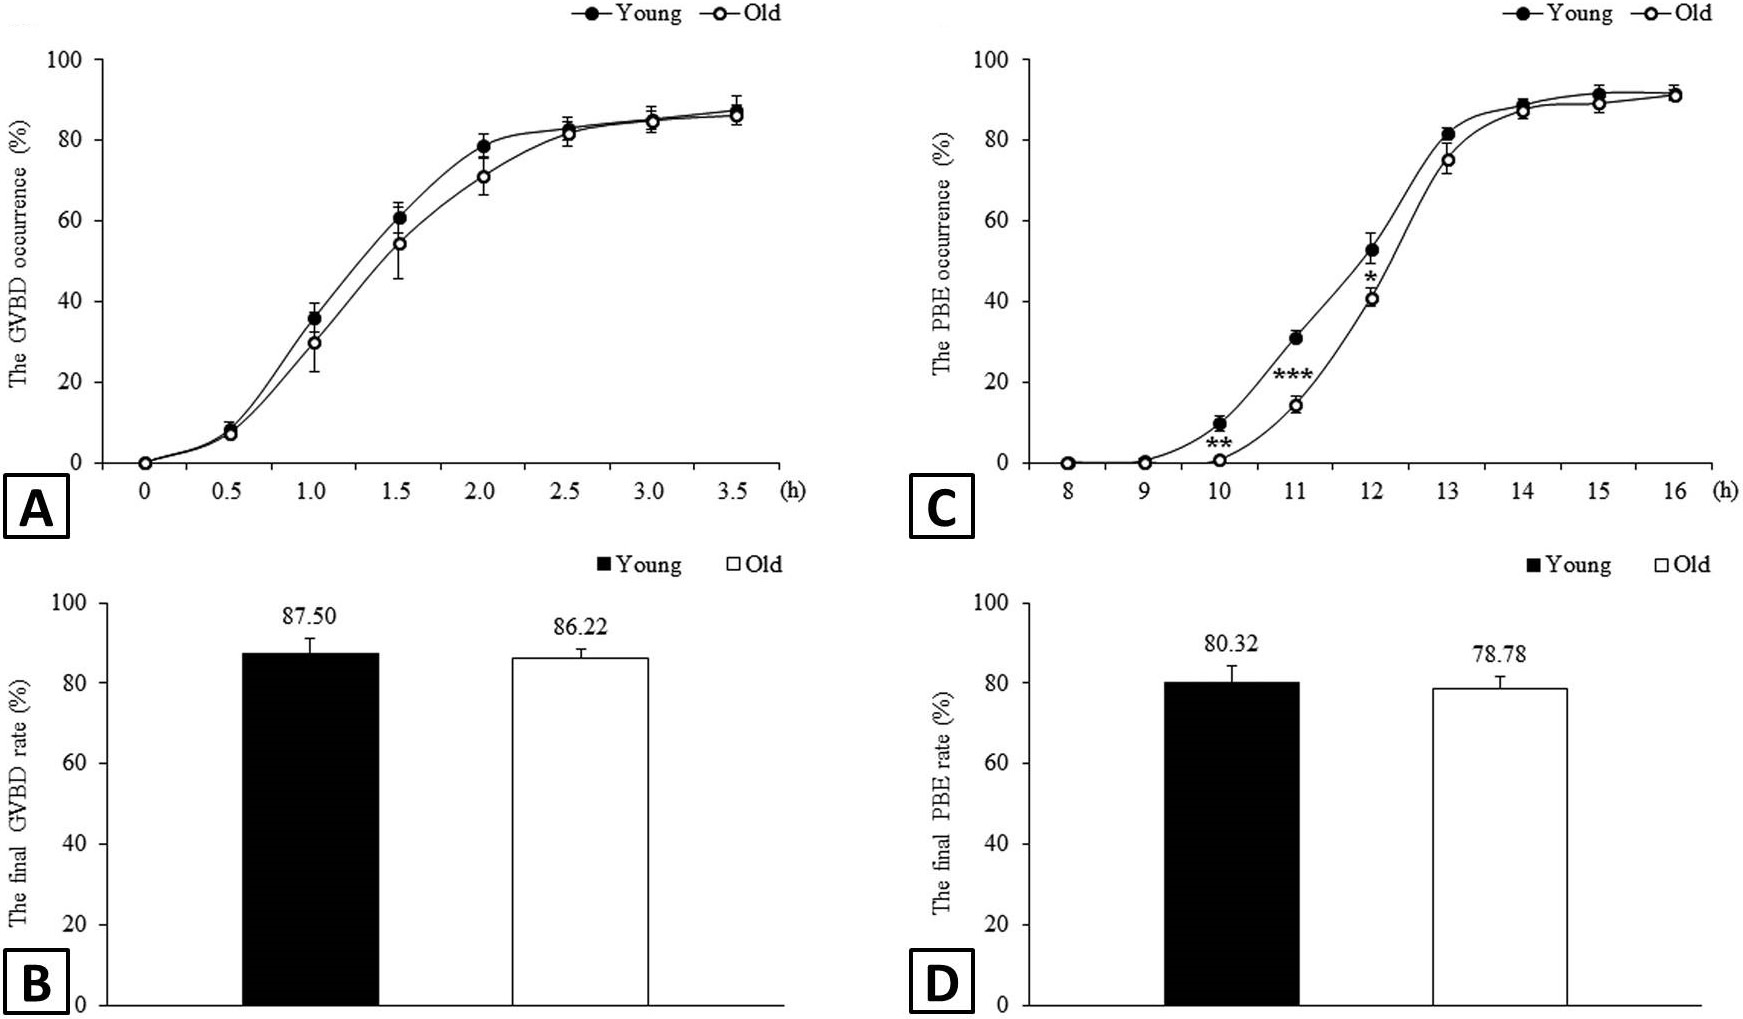
Fig. 1.
Kinetics of GVBD and PBE during oocyte maturation. Shown are the temporal trends of GVBD (A) and PBE (C) occurrence during IVM and the final rates of GVBD (B) and PBE (D) in oocytes. Number of oocytes analysed in total: n = 150 in the young group; n = 147 in the aged group. *P< 0.05, **P< 0.01, ***P< 0.001.