
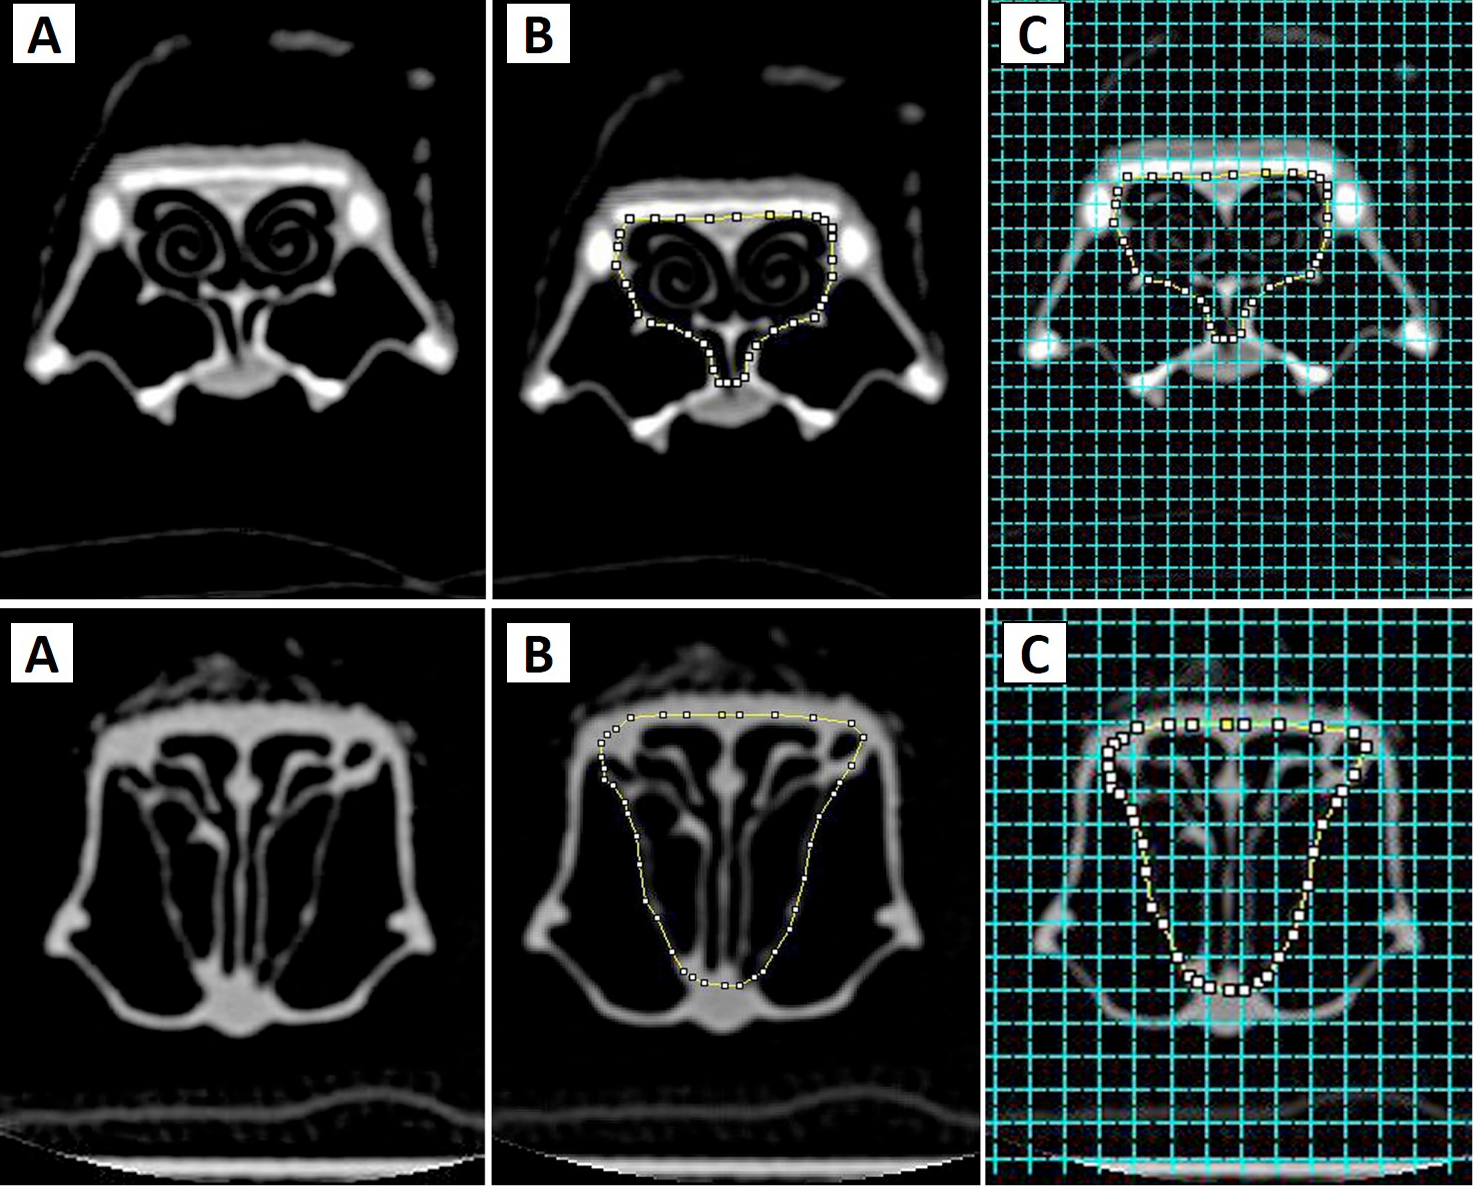
Fig. 1.
Computed tomography (CT) images of nasal structures of the seagull (top panel) and stork (bottom panel). A, a transverse section of nasal cavity; B, application of manual planimetry to obtain sectional cut surface area of the region of interest; C, a point counting grid superimposed on a CT section.